These notes continue with the use of function definitions inside of Python components within Grasshopper are for optional reading.
1. Python Libraries Continued
Rhino graphic libraries used in the examples are:
Rhino Common Libary
- library functions for Rhino Python, most of which are
also available to the Python scripting component within Grasshopper. This
library is referred to as "Rhino"
in the examples we will cover in the workshop notes. The Rhino Common function library documentation most useful to these workshops is located in the Geometry link
Rhino Script Syntax
Library - library
functions
for Rhino Python, most of which are also availble to the Python
scripting component within Grasshopper. This library is referred to
as "rhinoscriptsyntax"
in the examples we will cover in the workshop notes.
2. Interactive Split Average Method After Dr. Tony DeRose, Pixar
This
example is based upon a method that was visually displayed by Dr. Tony
DeRose Senior Rsearch Scientists and Lead Research Scientist at Pixel
during a master class at the Virginia Film Festivall on November 9,
2017 under a Page-Barbour grant proposal chaired by professors Sara Maloni
(Math) and Earl Mark. Following the lecture, I
reproduced the method with the Python component within Grasshopper for
Rhino. Note that although this isn't directly based upon or verified
against the code written at Pixar, the explanation given by Dr. Rose
seemed more than adequate to reproduce the algorithm. Since these notes
are being generated very quckly, for more complete detail the full
Grasshopper file is available on this link: deRoseSpAvgDisplayIterative.gh and applied to the Rhino file fourPts.3dm. The technique was used in modeling the skin of the lead character in Geri's Game.

Source: computerhistory.org (From Pixar's Geri's Game Rendering)
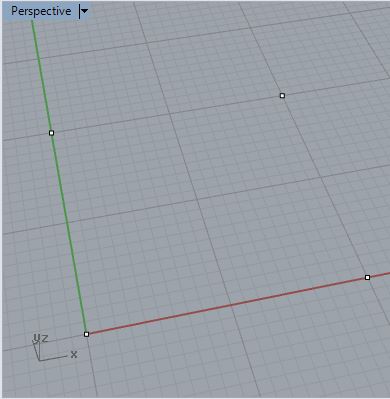
1. Begin by placing four corner points witin the ground plane.
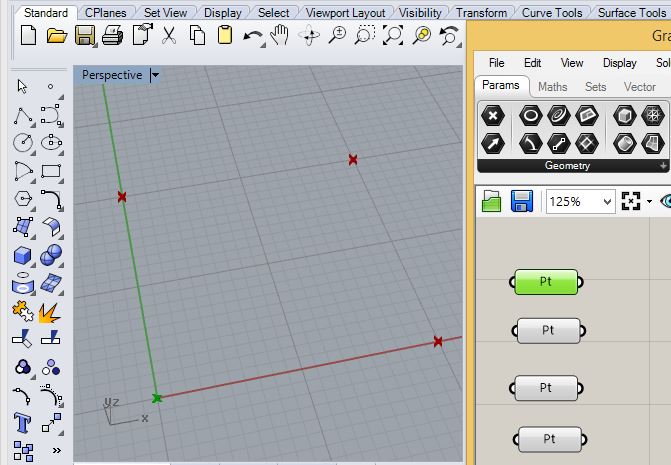
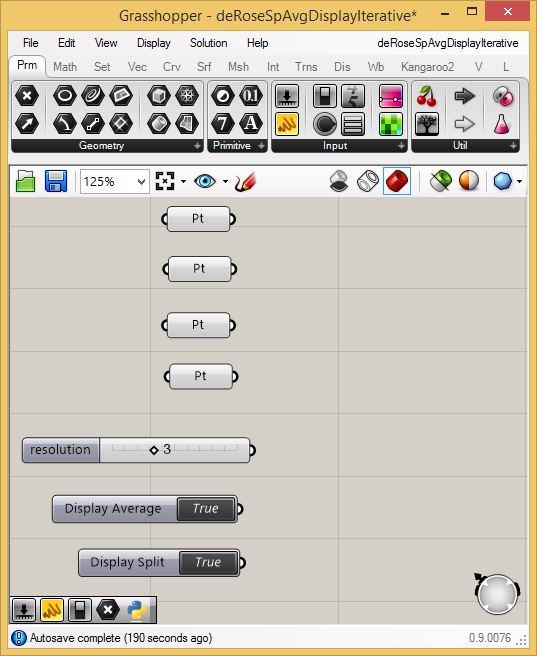
2. Open Grasshopper and create four point parameters to correspond to the points in Rhino from the bottom left in counter clockwise order.
3. Next, create the following integer and boolean toggles are added.
| Slider Name | Type Number | Range | Current Value |
| resolution | int | 1 to 7 | 1 |
| Display Average | boolean | True or False | True |
| Display Split | boolean | True or False | True |
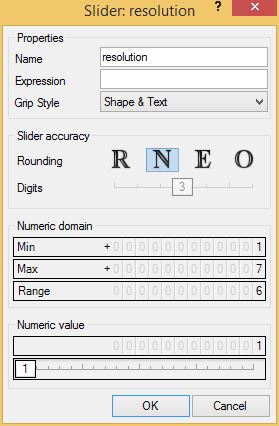 |
The slider and boolean toggle componets appear as follows in the grasshopper Canvas window.
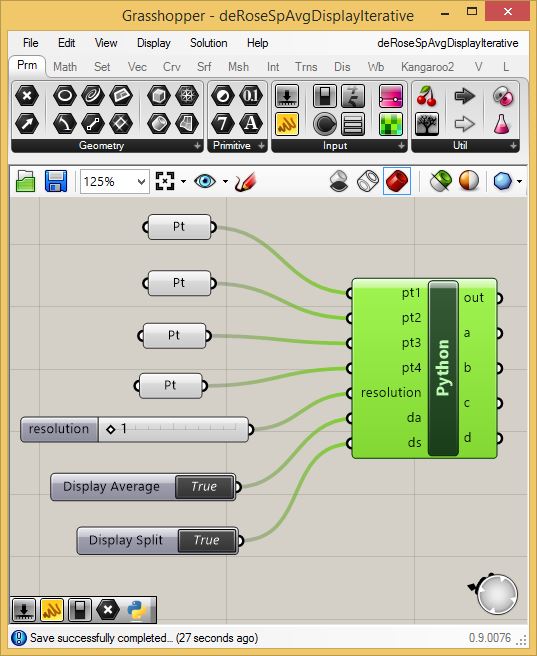
4. Next, go to the Math tab in Grasshopper, add a Python Scripting component, and create input variables for the four corner pts as type "Point3d", the variable "resolution" as type "int", the boolean toggle variables "da" and "ds" as type "boolean", and add on the out put variables "b", "c" and "d".
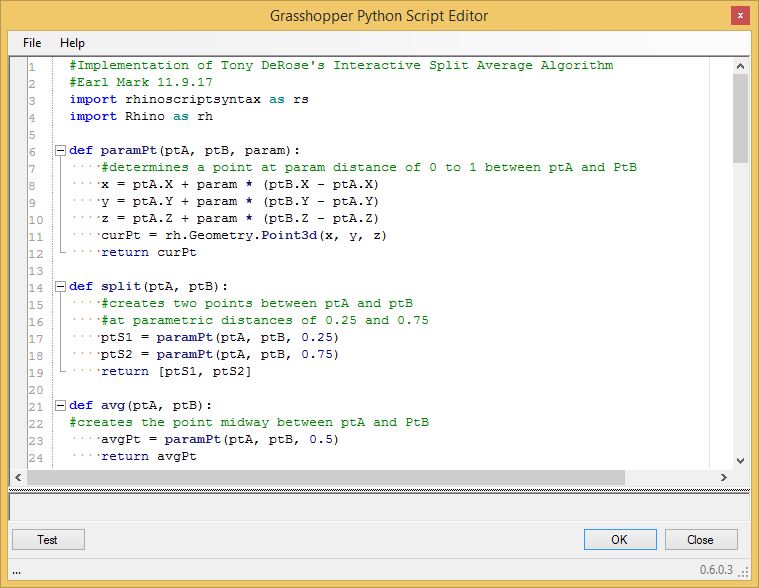
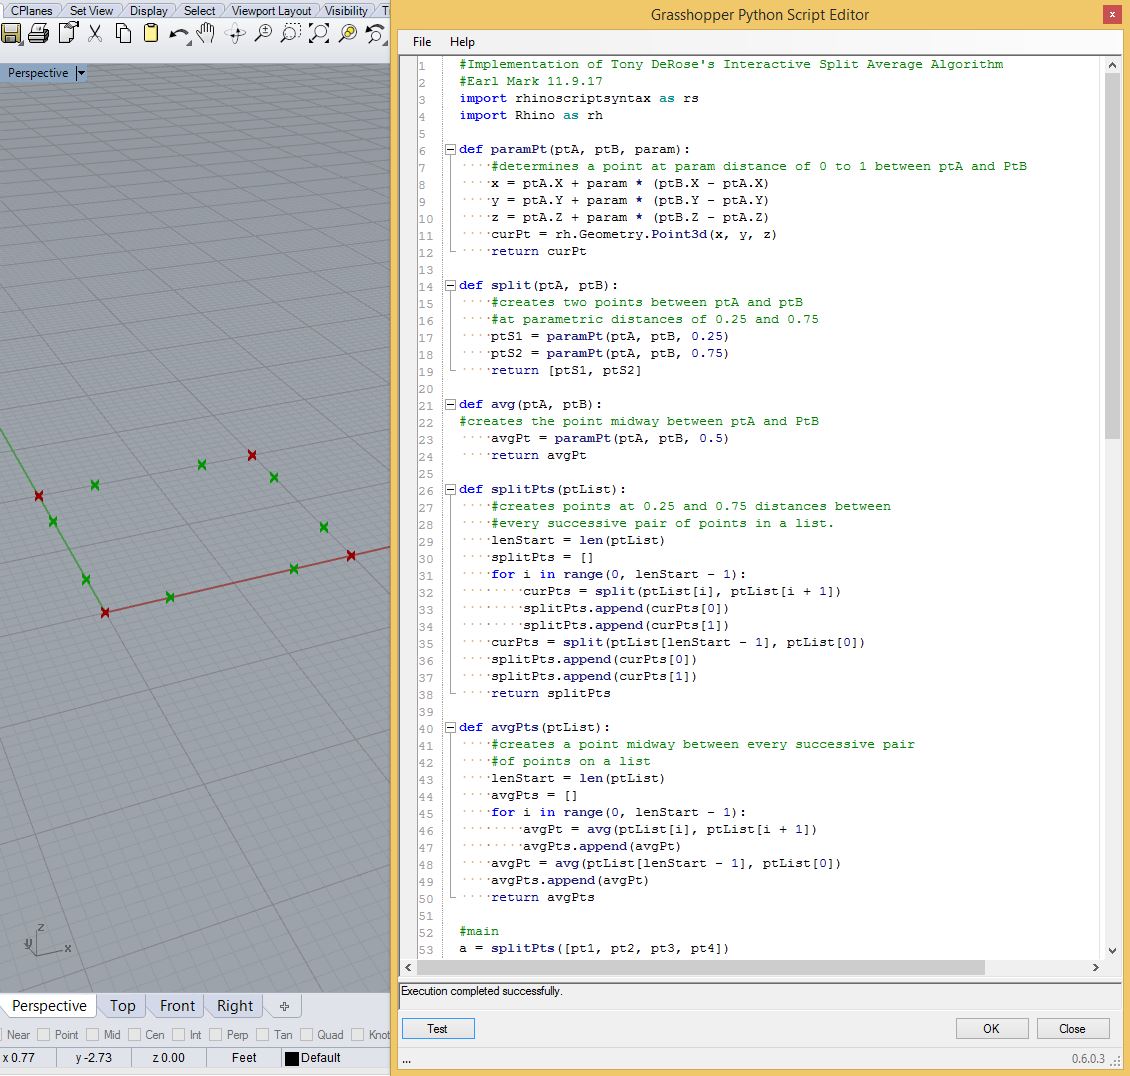
5. Next, open the Python Scripting component, add the rhinoscriptsyntax library and Rhino libraries , and create functions "paramPt" that finds a point at a parametric disctance of 0 to 1 between two points, "split" that finds two points at 0.25 and 0.75 parametric distances between two points, and a function "avg" the finds a point midway (0.5 parametric distance) between two points.
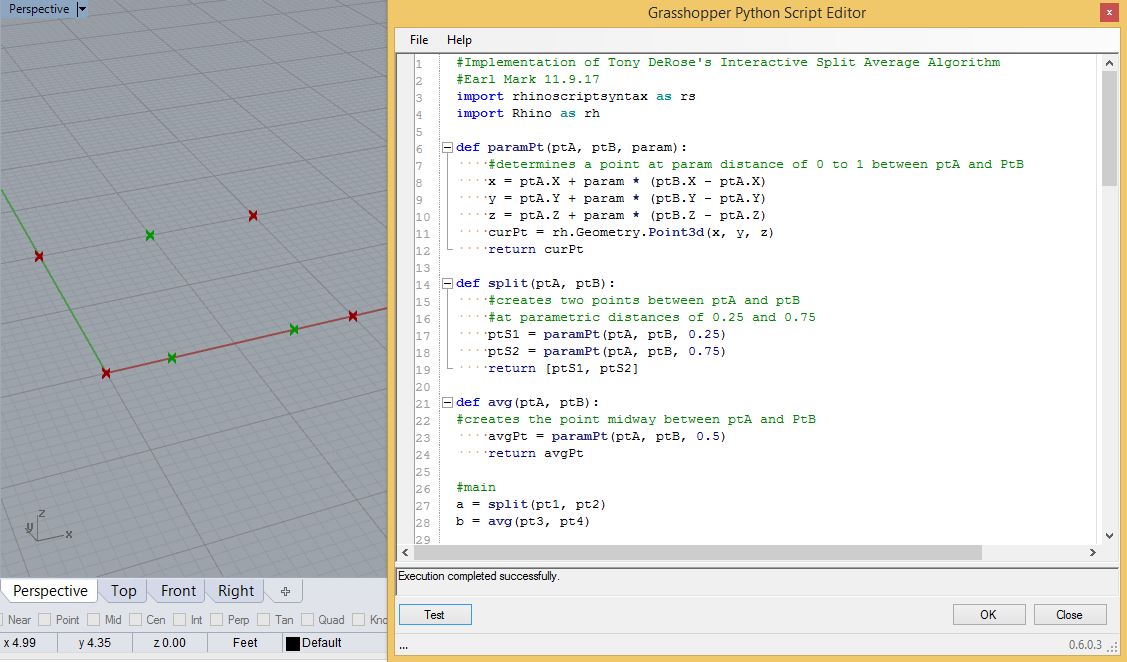
6. Test the "split" and "avg" functions with the points in Rhino with respect to the first two points in Rhino along the X-axis, and the last two points in Rhino respectively by setting the output of the "split" function to output variable "a" and the output of the "avg" function to output variable "b" as an interim test.
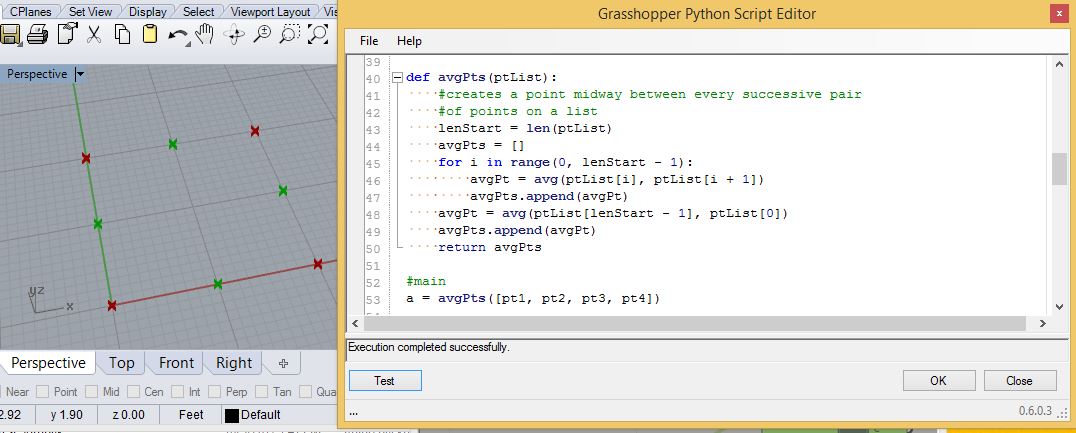
7. To split or average more than one pair of points add the function "splitPts" and function "avgPts" and begin testing this on the four initial points in by setting the output variable "a" to result of the function "splitPts" as follows.
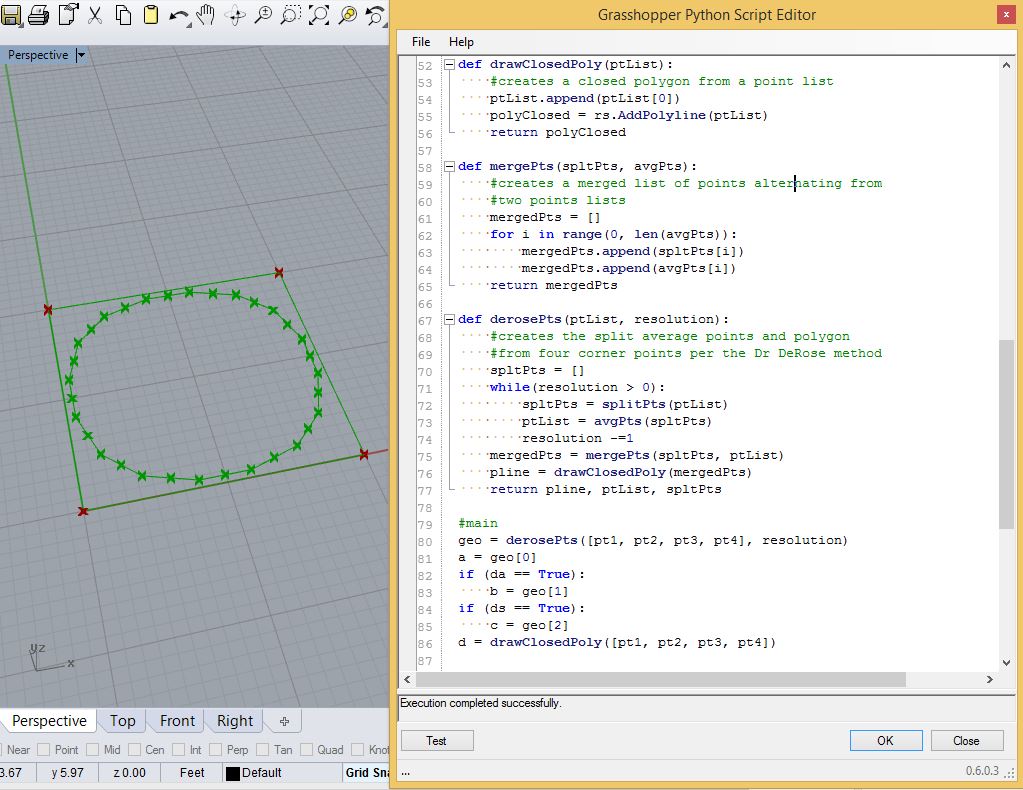
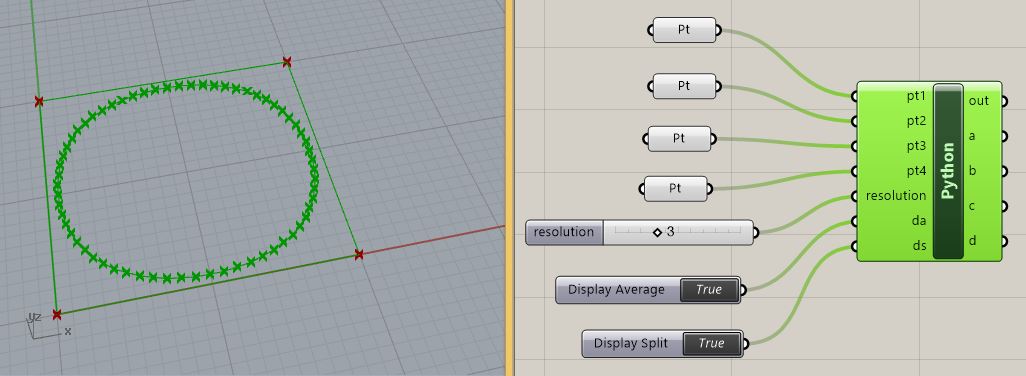
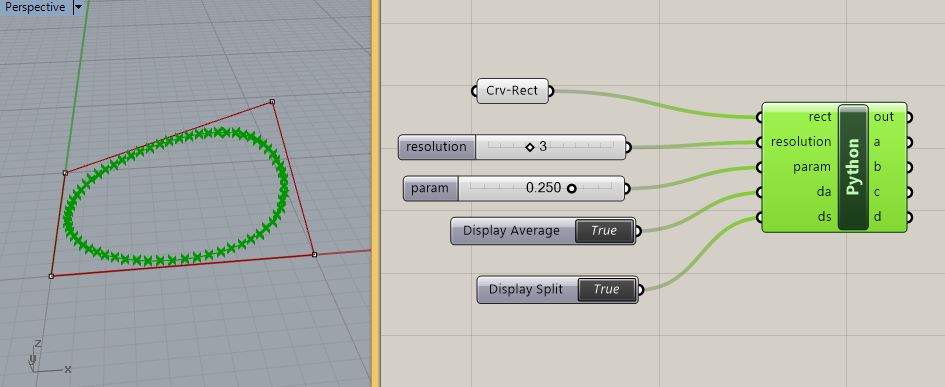
8. The final part of writing the Split Average Interactive scripts involves add three additional top level functions including "drawClosedPoly" that draws a closed polygon from a point list, "mergPts" that creates a single list of points alternating between two lists of points (the list of split points and the list of average points), and "deRosePts" that launches that initiates the lists and applies the split and average points interative for whatever level of "resolution" is desired. Here the "resolution" is set to 3.
Or, more directly, see the component settings used are as follows.
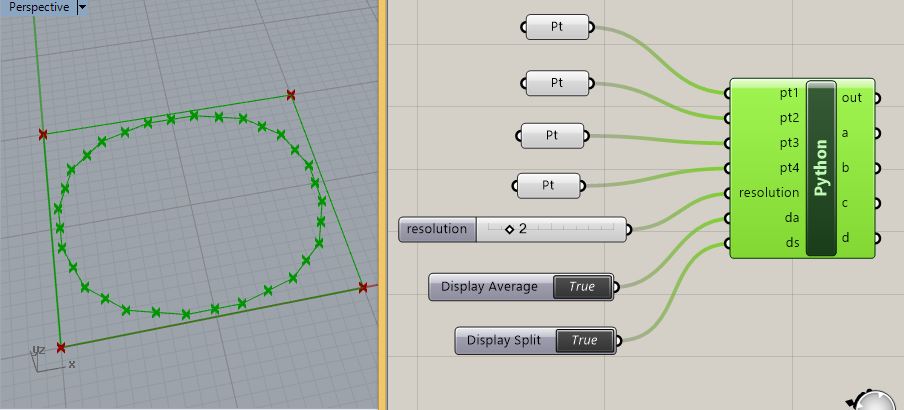
And here it is at resolution 3.
9. The Boolean operators have been integrated to see the "Average" and "Split" points separately.
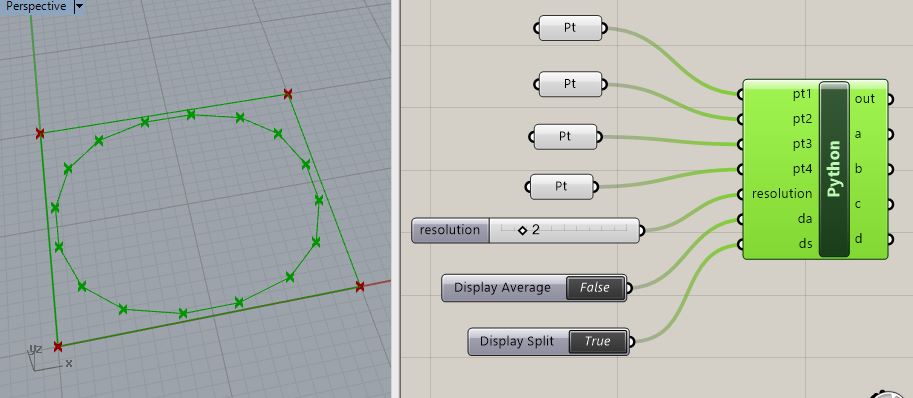
Thus, turning off the boolean parameter for "Display Average" at resolution 2 we get the following result.
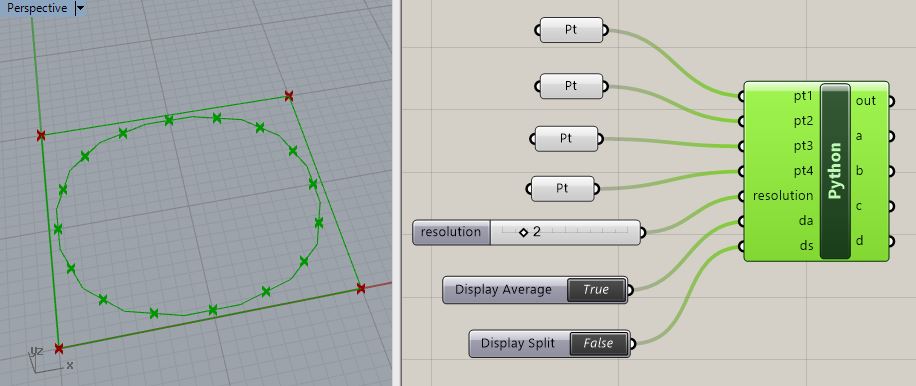
And, turning tuning back on the "Display Average" toggle and turning off the "DisplaySplit" toggle at resolution 2 we get the following result.
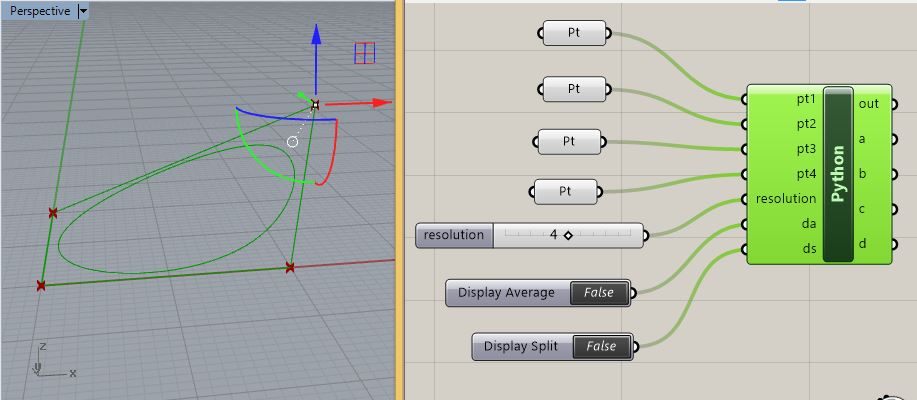
10. Adjusting the points horizontally and vertically maintains the points and adding greater resolution creates a similarly coherent curve generated by the tool. Here is the result with the boolean toggle switches turned off at resolution 4.:
And here is the same setup with the points turned back on at resolution 3

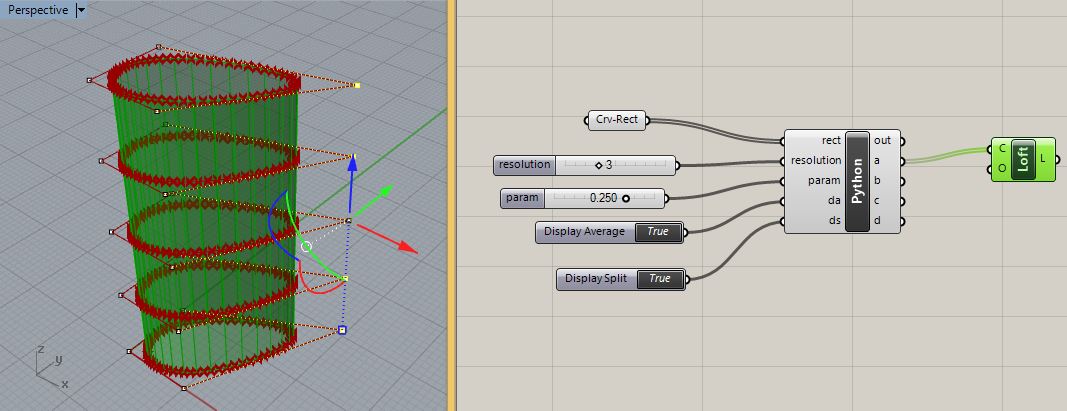
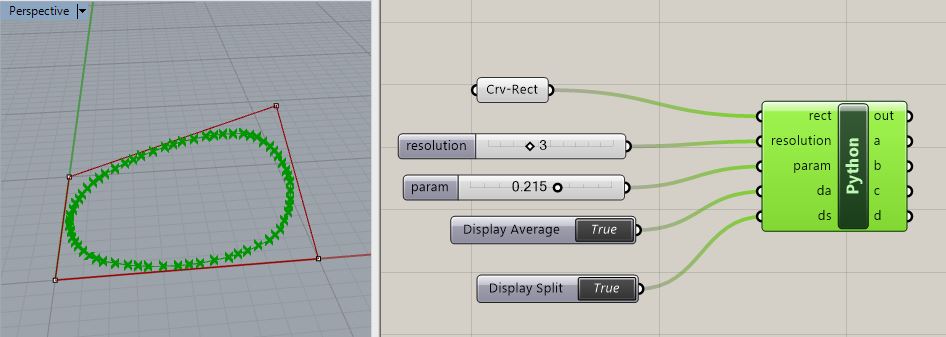
11. Similarly, the script deRoseSpAvgDisplayIterativeParamRect.gh creates a split average curve from a rectangle as in the file rect.3dm.
However, note that a parametric variable has been added which permits the split to occur over a variable parametric distance from the corner points. At the setting of 0.215 the points in the curve tend to move closer to the shapeof the bounding rectangle. This is a variation in the algorithm not demonstrated in the initial DeRose presentation (but perhaps is already within the tool).
12. Following the same basic plan the script deRoseSpAvgDisplayIterativeParamRects.gh creates a series of split average curves from a series of rectangles that in turn are lofted together is in the case of the Rhino file rects.3dm. The curves output to variable "a" are imported into loft curve component in Grasshopper.