COMPUTER
AIDED
ARCHITECTURAL DESIGN
Workshop 15 Notes,
Week of November 26 , 2018
SUN STUDY WITH V-RAY AND LADYBUG PLUGINS TO GRASSHOPPER
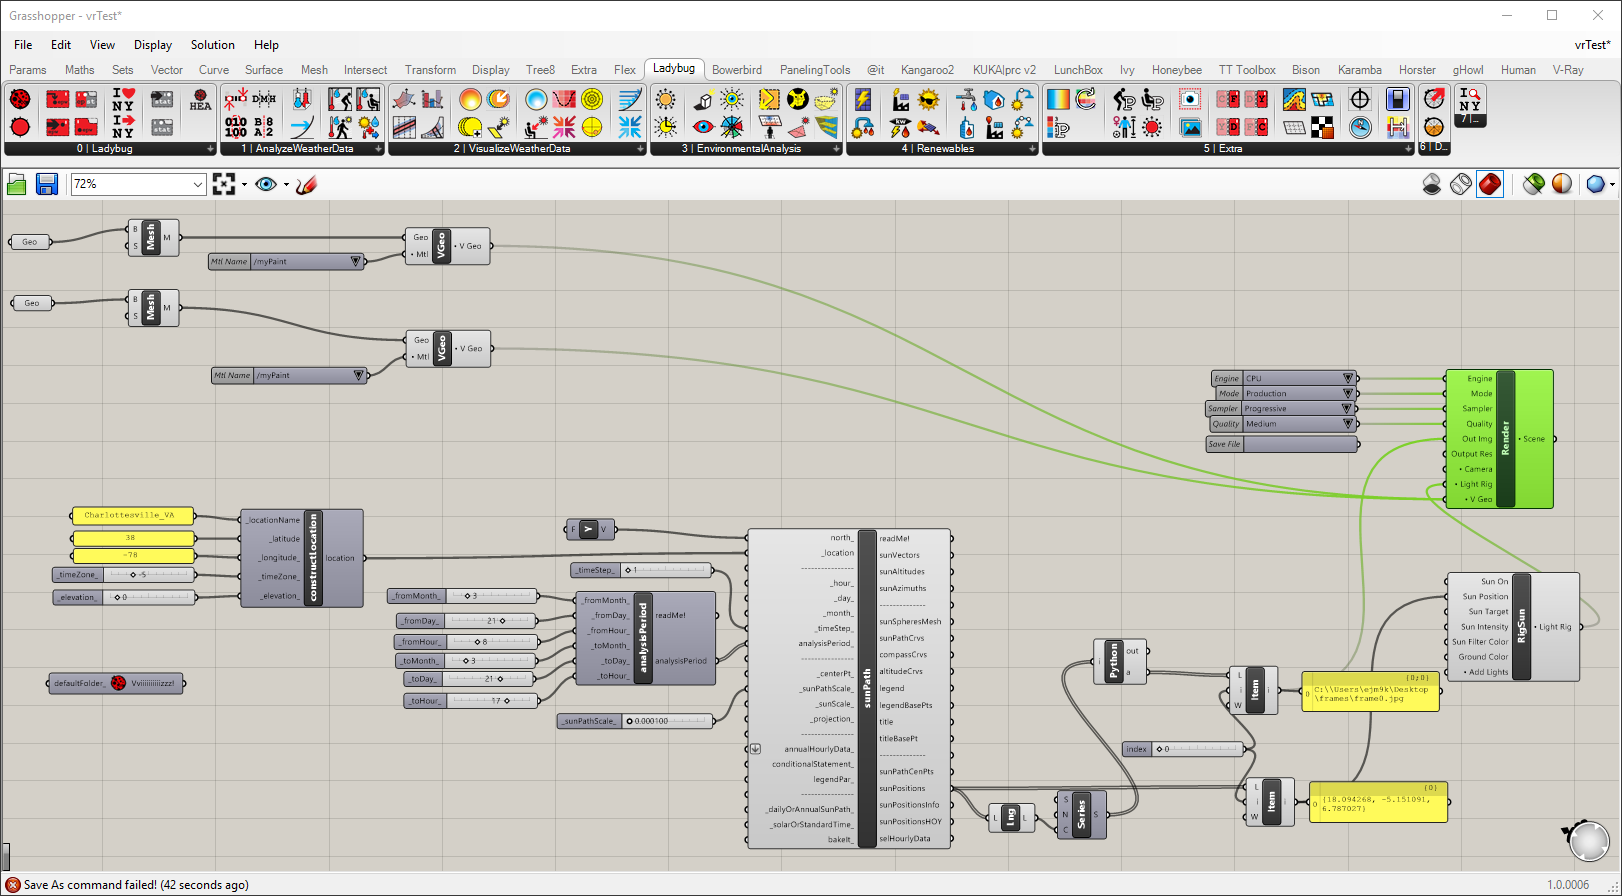
These notes demonstrate a method of making a solar sun study. The Grasshopper Plugins for V-Ray and Ladybug are utilitized. The example files "sunTest.3dm" and "vrTest.gh" are placed in examples folder on the classes server under the subfolder "vrayTest. This is a a prolonged sequence of steps. See overview Grasshopper canvas window here and magnified at the end of these workshop notes (select image below to expand view).
Summary
In summary, the method we use in here supplments the animation techniques documented in the previous workshop notes 14..The details are described in three parts beginning with setting up a model in Rhino, setting up Grasshopper compenents in V-Ray, and then setting up Grasshopper Components in Ladybug. The current release of the V-Ray Grasshopper plugin permits one sun path frame to be rendered at a time. Future implementations may permit more than one frame to be specified in which case some of the methods illustrated here will likely change.
I. Initialize Setup in Rhino
1. Create a flat surface on the ground and a cone at its center.
2. Activate the V-Ray renderer via the "Render/V-Ray" menu. Open up the V-Ray asset manager and create generic materials "ground" and "mypaint" and assign them to the ground surface and cone respectively.
II. Initiate Grashopper V-Ray plugin.
1. Activate the Grasshopper, and create Geo parameter components for the ground surface and cone.
2. Within the Mesh tab, add a Mesh from Brep component for each of the Geo components and connect them.
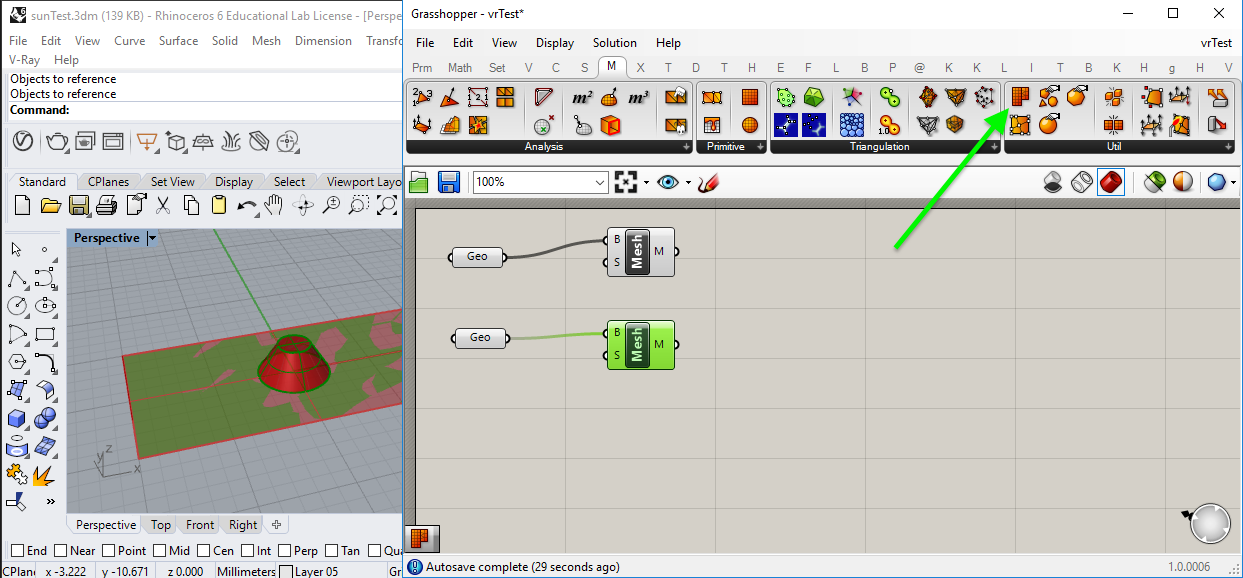
3. Open the V-Ray tab and add a V-Ray Geom components for each of the two Mesh components and connect them.
4. Add two V-Ray Material from Project components, select the V-Ray materials for cone and ground surface as appropirate to each V-Ray Geo component and connect them to the the "Mtl" corresponding "Mtl" input ports.
5. Add a V-Ray Light Sun Rig System to the canvas window. We will use its default values for the initial test.
6. Add a V-Ray Render component to the canvas window.
7. From the V-Ray Sun Rig System component, connect the "Light Rig" output port to the "Light Rig" input port of the V-Ray Render component. Also, form the V-Ray Geo components, connect the "V Geo" output ports to the "V Geo" input port of the V-Ray Render component.
8. Right-mouse-button-click on the "V-Ray Render" component, and in the pop-up dialog that follows select the option to "Show Controls". This results in the selection option parameters to the left of "V-Ray Render" component.
9. Change the "Mode" control from "Interactive" to "Production".
10. Right-click on the the V-Ray Render component and select the "Render" option. Adjust the Levels as needed in the V-Ray Frame Buffer window.
II. Initiate Grashopper Ladybug Plugin.
1. Open the Ladybug tab and place a "Consruct Location" component in the canvas window.
2. Use the yellow panel text boxes and number sliders to enter the numerical values indicated as input ports to the "Construct Location" component. Note that the time zone of -5 GMT (Greenwich Meantime Offset) is use. An elevation of "0" is used in this test, even though the elevation of Charlottesville is significantly higher.
3. From the "Visualize Weather Data" sub-area pulldown menu in the Ladybug plugin select the "Ladybug_SunPath" component and drag it into the canvas window. (Note: on later releases of Ladybug this is also available in the the "Visualize Weather Data" and above the pull down menu . In earlier releases of Ladybug it is necessary to go to the pull down menu.
![]()
Drag the compent into the Grasshopper convas window. Don't let the number of input ports concern you. We will be using a number of default values.
Note also that we must place a "Ladybug Ladybug"component in the canvas window to activate all the needed utilities for the Ladybug plugin.
4. From the Vector tab, add a unit "y" vector to the "north' input port of the "Visualize Sun Path" component.
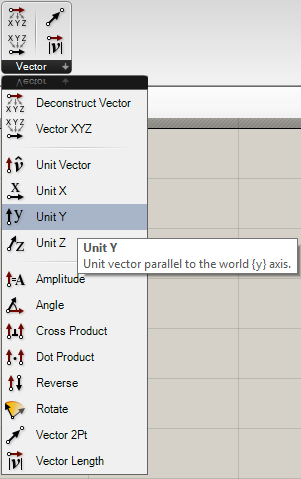
Add Connect the "location" output port to the Visualize Sun Path" "location" component.
4. From the Ladybug "Analyze Weather Data" area, add an "Analysis Period" component.
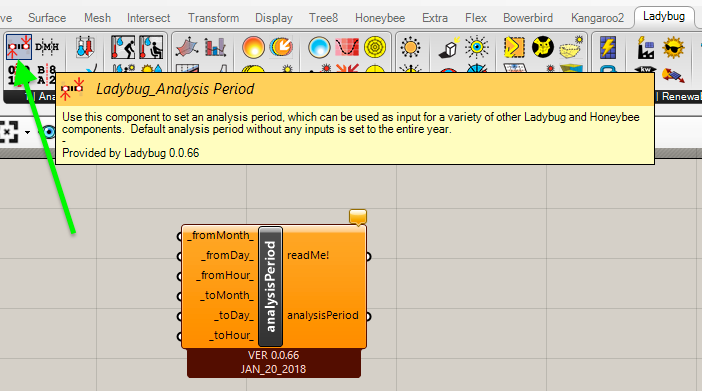
Add number sliders and associated numerical inputs for the start month, day and hour and the end month, day and hour, and then connect the "analysisPeriod" output port to the corresponding "analysisPeriod" input port" of the sunpath component.
5. Add a number slider range in values from 1 to 60 for the "timeStep" input port and a number slider ranging in values from 0.00001 to 1 for the "sunScale input port of the VIsualize Sun Path component.
6. The modified perspective view in Rhino reveals sun path and sun positions at 1 hour intervals.
7. Now we look at the the output positions of the sun from the "Sun Path" component.This invovles adding three compoents.
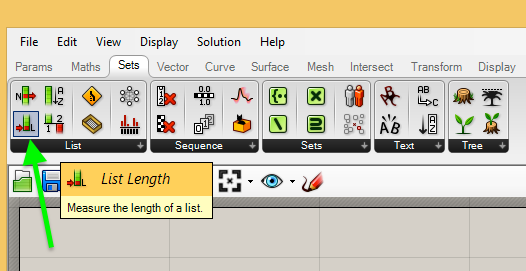
From the "Set" tab of Grasshopper, select the List Length compenent to determine the number of elements in a list (e.g., number of points in a list of points):
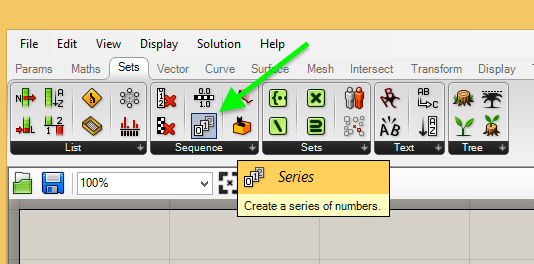
Also, From the "Set" tab of Grasshopper, select the "Series" component to generate a series of numbers (e.g., 0, 1, 2, 3 .... ):
As shown in the figure below, connect the output of the "sunPositions" to the input port of the Length component to establiish the number of sun positions. Connect the ouput of the length component to the input port of the "Series" component generate a squence of numbers integer numbers from 0 to the Length - 1 at intervals of 1.
Add a Python script as also shown in the figure below. It received as as input the sun position points into the "Point3d" variable named "pts" and the series of index numbers into the "int" variable named "i". Add the Python code as shown in lines 11 through 19 in the Script Editor. The variable "frame" on line 16 is assigned the pathway and file name of each frame within the animation. Note: the combination path and file name must be a working folder on your computer system (e.g., "C:\\Users\ejm9k\Desktop\frames\frame1.jpg". If not, then due a bug within the Grasshopper plugin, the V-Ray render buffer will result in a blank screen. This bug has already been reported.The output of the Python script is passed through the variable"a" which is assigned the the value of the variable frame. (Note: this could have been handled more directly by replacing line 16 with the expression:
a = str("C:\\\Users\ejm9k\\Desktop\frames\\" + "frame" + str(i) + ".jpg".
In the above expressions, he use of "\\\" is a special text string notation that resolves to "\\", and the use of "\\" resolves to "\", Thus we would get a pathway and filename such as "C:\\Users\ejm9k\Desktop\frames\frame1.jgp".
8. We now add two more List components to selectively grab a sunlocation and filename for each index sun location in the sun path.
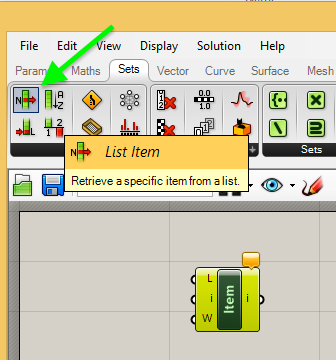
Yellow text panels are added to double check the output values of the path filename as well as the sunPosition. As evident in the image below, if the "index" slider is equal to 2, then the frame number is "C:\\Users\ejm9k\Desktop\frames\frame2.jpg".
9. These output list items are now added as the final inputs to the to the V-Ray Sun System and V-Ray render System components as shown in the figure below.
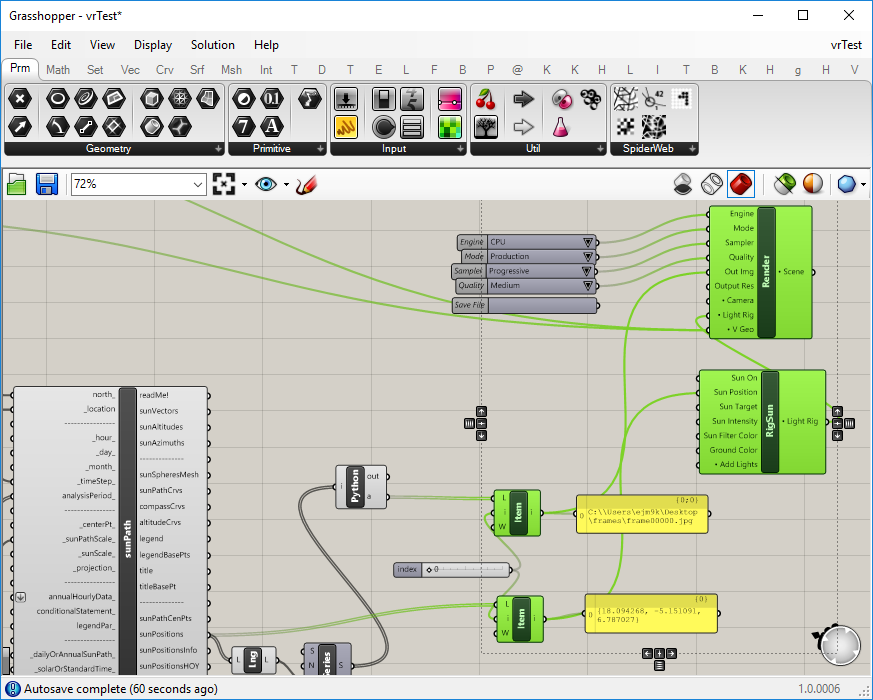
10. By advancing the number slider for for the index from 0 in the previous image to 1 in the image below, we in turn change the name of the frame number and the corresponding selected sun position.
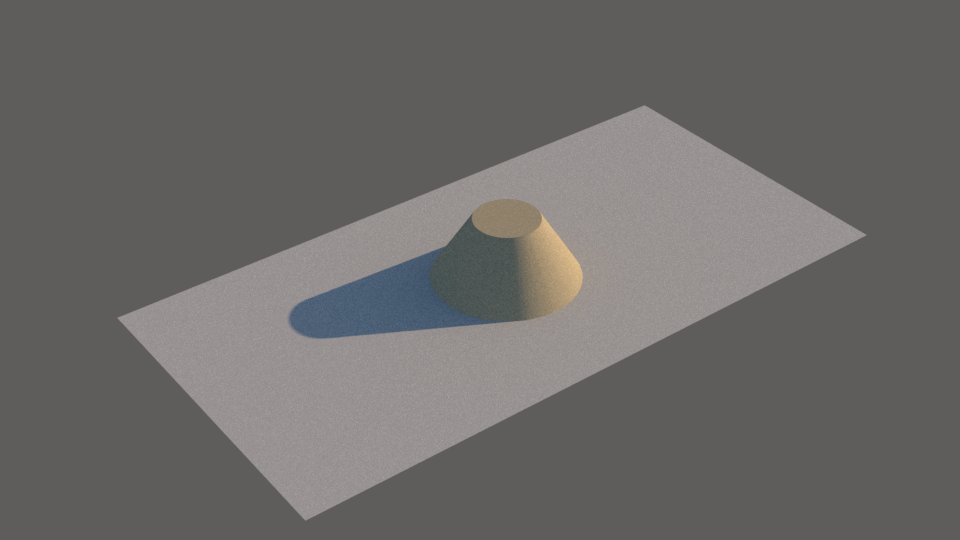
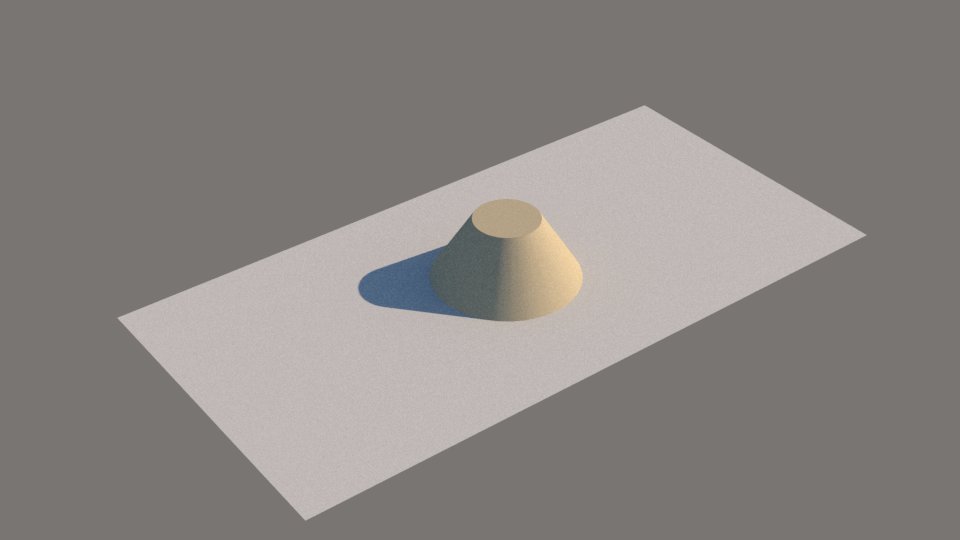
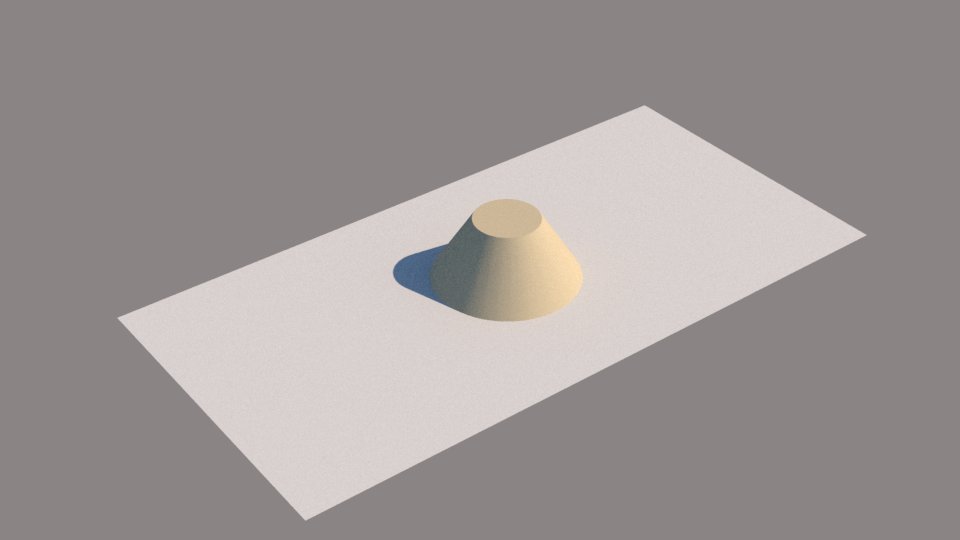
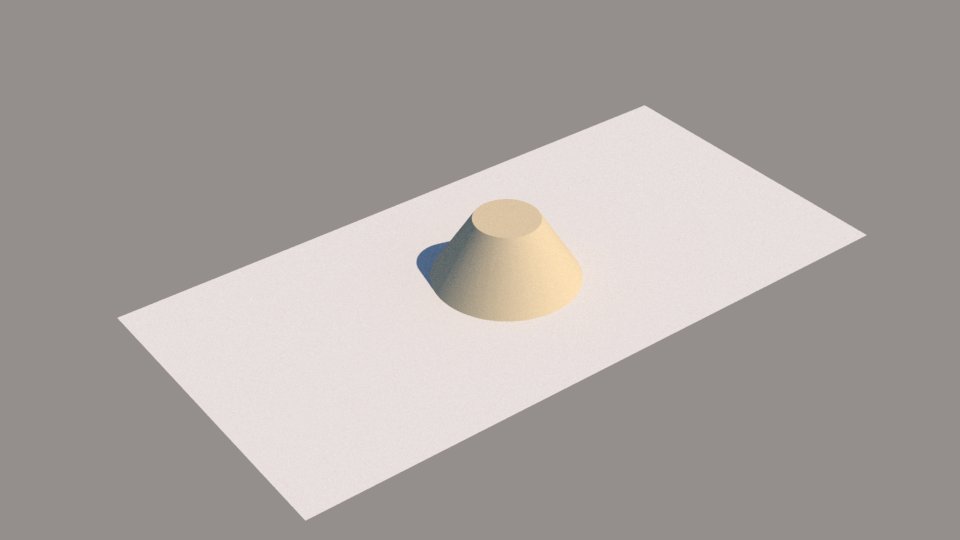
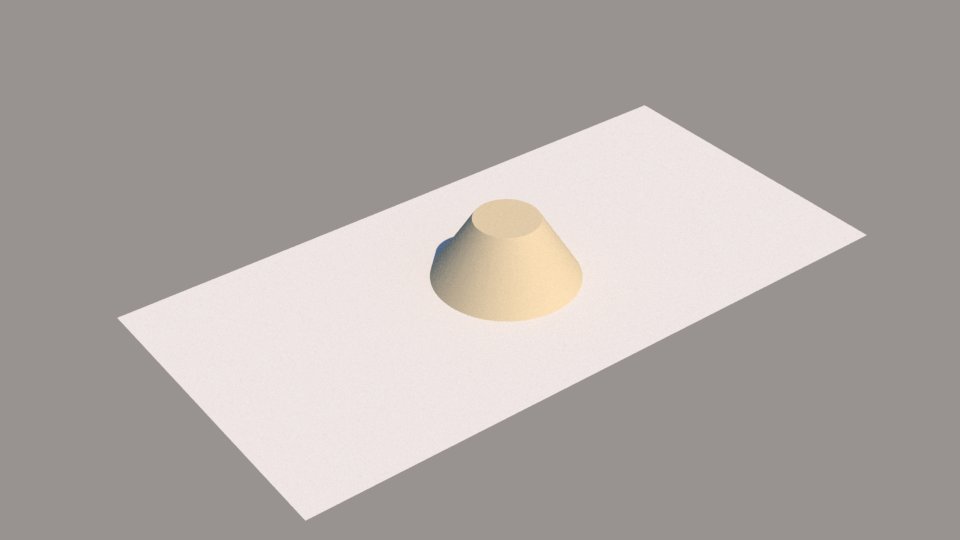
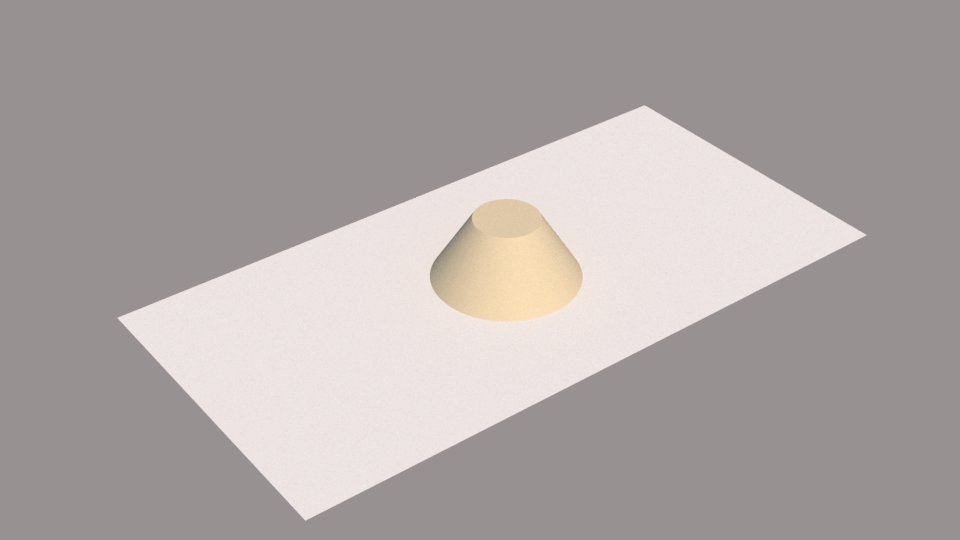
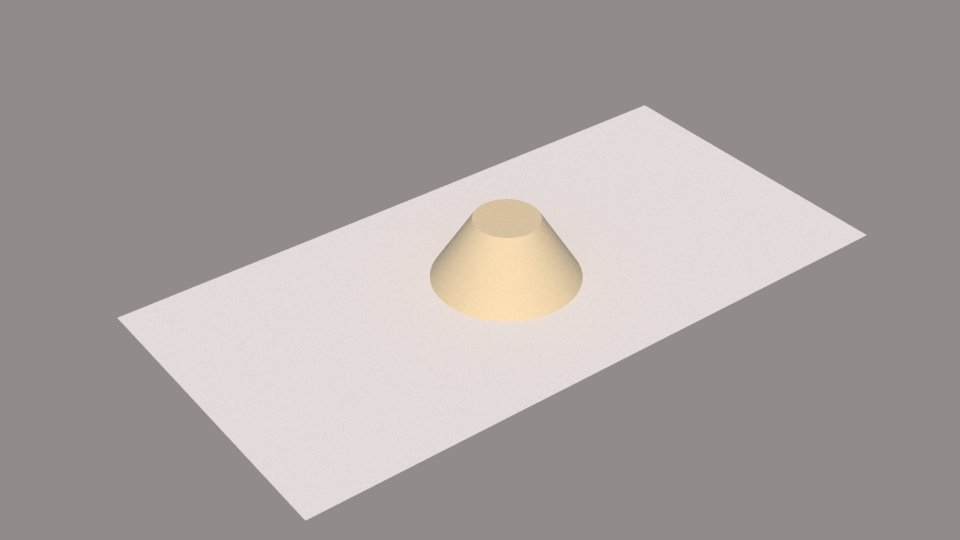
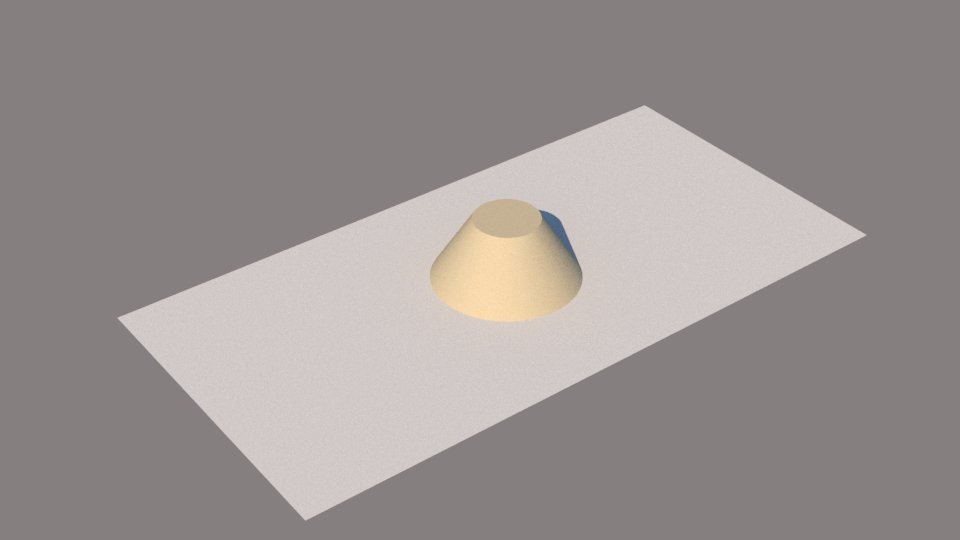
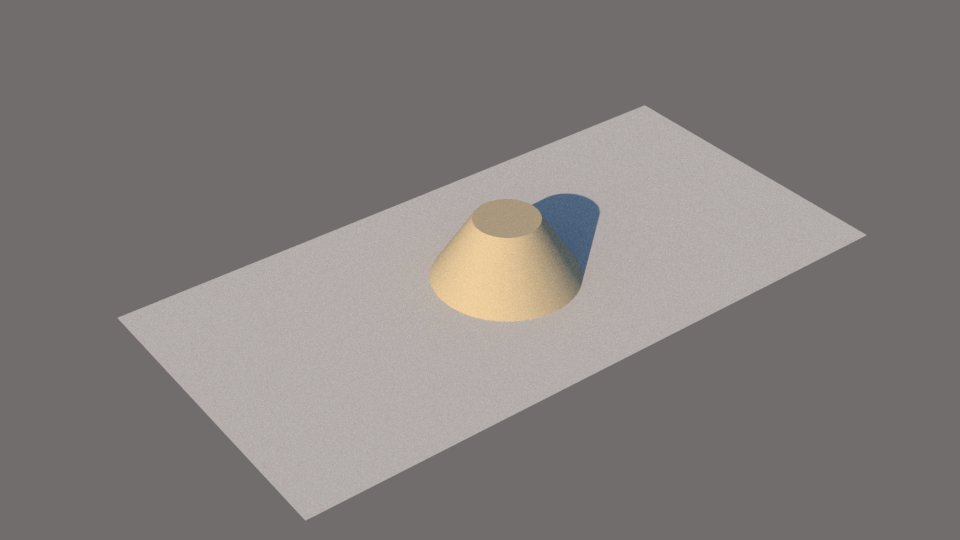
11. For example, the following image sequence is a series of jpg images output due to this method for frames 0 through 8.
 |
 |
 |
 |
 |
 |
 |
 |
 |
12. The overall Grasshopper file and Rhino File appears as follows (select image to expand view).