![]()
Workshop 7 Notes, Week of October 8, 2006
MicroStation Digital Terrain Modeling:
Basic Manipulation of Surfaces as Polygons:
1. Using 3D primitives, create a sphere.
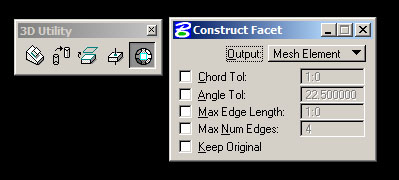
2. Go to 3D main > Utility > Construct Facet
Mesh Element- One object with many points [you will typically choose this]
Shapes- independent shapes
3. Grab the object to convert. [the object is now a polygon mesh]
4. Modifying the mesh:
Constructing Terrain:
There are three basic steps involved in creating a digital terrain model using MicroStation and Geopak.
2. Digitize Countours into MicroStation
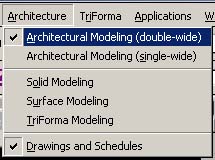
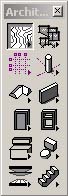
Bentley Architecture has within it a complete set of tools for drawing and later processing contour and terrain model information. These tools are located within the main Architectural Modeling Tools palette, which can be found under the Architecture menu of Bentley Architecture.
 |
 |
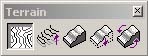 |
Once you have these tools on screen, choose the first tool - Place Contours.
The floating dialog box gives the following options:
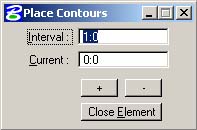
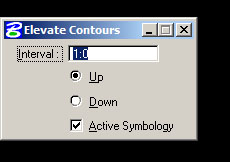
The Interval is the between-contour elevation difference from your contour map. You might be looking at every 1 foot contours (as shown), or every other (2 foot), or possibly 5 foot, 10 foot, 20 foot, etc. This is determined by your map.
The Current setting is the contour elevation that you are currently drawing. You will set this to the proper elevation for each contour as you draw it.
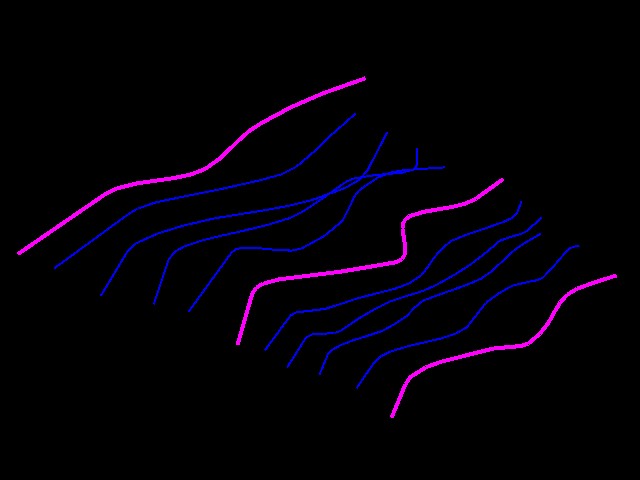
Begin to digitize contours on screen with the mouse. The contours will be drawn as curved lines.
When you have finished one contour, right-click to end it, then hit the [ + ] button in the floating window to increment the current elevation to the next step as per the interval. Continue drawing the next contour.
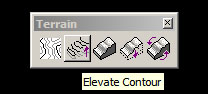
Additonally: If you have a file of contours that are all flat on one plane, you can elevate the contours with the following steps:
  |
|
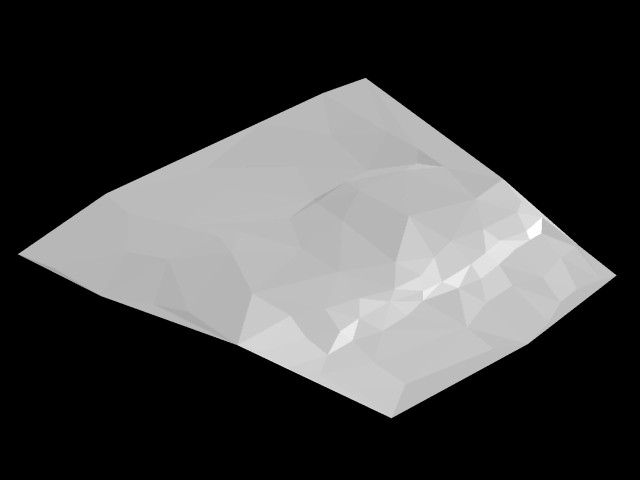
3. Process the contours into a surface Terrain Model
There are two ways to create a surface Terrain Model: The Facet Method will allow you to see the triangulation on screen, allow you to "drape" objects onto the surface, as well as cut a holes into the surface. The Geopak Method of triangulation is more behind the scenes, and will allow you to conduct further analysis of the terrain such as determining drainage patterns.
Facet Method
Now that you have contours, you need to convert them into a triangulated surface.
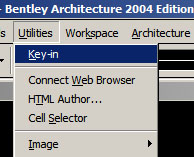 |
1. Go to Utilities>Key-In |
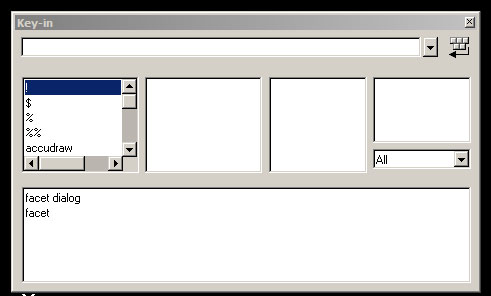 |
2. Type in "facet dialog" to open the Facet menus. |
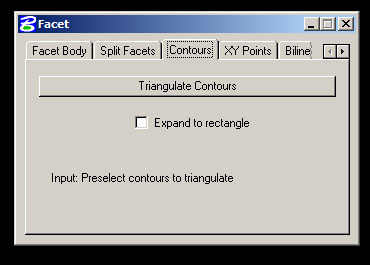 |
3. Select the Contours Tab. Select your set of contour lines and hit triangulate contours. |
4. Modifying the surface:
|
If you have lines in 2d (such as a plan) that you want to "drape" over or cut a hole in the model, take the following steps:
| 1. Go to Tools>Surface Modeling> Modifying Surfaces | |
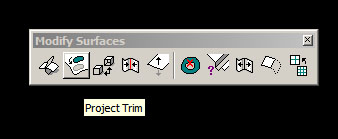 |
2. Select Project Trim (2nd tool) |
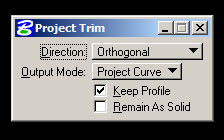 |
3. To drape lines across the model: Change the output mode to "Project Curve". Grab the surface, grab line, then click on screen. |
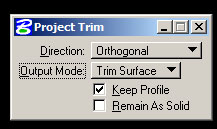 |
4. To cut a hole in the surface: Change the output mode to "Trim Surface". Grab the surface, grab line, then click on screen. |
Geopak Method
Now that you have contours, you need to process that data into a series of files that will successively build a terrain model. The files are as follows:
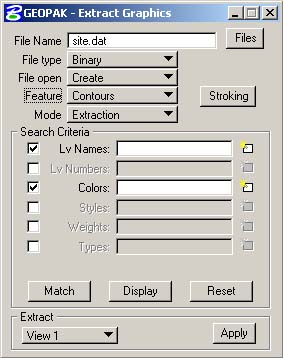
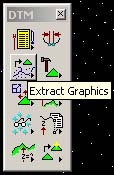
The First Step - Extracting Graphics
|
Step Two - Convert data file to TIN
 |
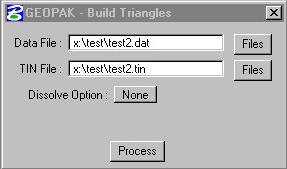 |
Once you have a Data file, you must triangulate between its points to generate a surface description.
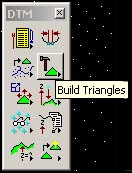
Using the Build TIN tool, you simply choose the Data file to start with and a new TIN file to create. Hit the Process button and the conversion will take place. When the process is complete, again quite fast, the status bar of MicroStation will tell you "Build Triangles Complete" |
Step Three - Load TIN data into view
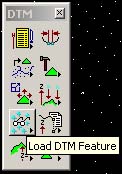
Once the TIN file is processed, we simply need to display its contents to the view and optionally write it to the MicroStation file for later use. This is accomplished with the Load DTM Features tool.
 |
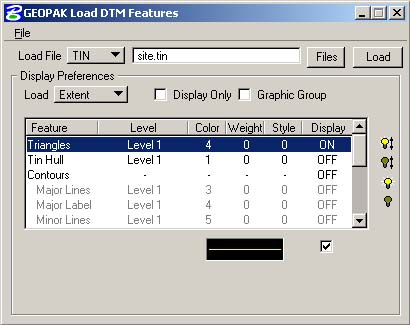 |
Using the Load DTM Features tool, select the Type of file at the top left [DATA - TIN - LATTICE], and the file to load from.
Next select the feature type you wish to see, such as Triangles, and turn it on. At the bottom of the tool, symbologies for this operation are shown and are editable. Select the Level, color, etc. that you wish to use for the triangles. Double-Click on the colored line at the bottom to change these settings. Turn off the Display Only checkmark if you want to write these to the file instead of just look at them. Make sure no other features are turned on by scrolling up and down the list of available feature types. Click Load at the top right to see the Triangles. |
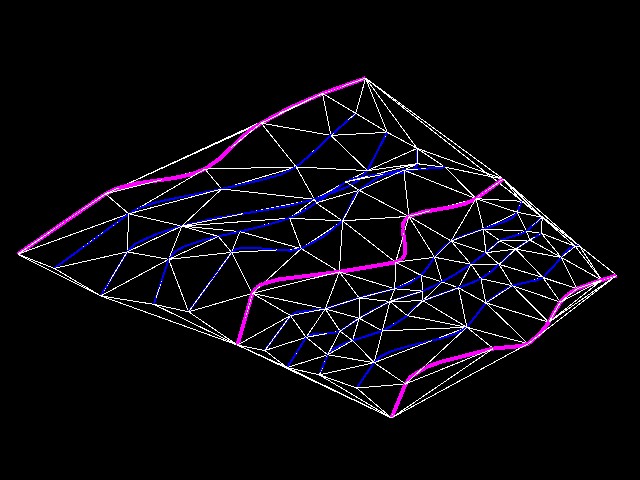 TIN mesh overlayed onto contour |
 |
Step 4- Optionally analyze the DTM model
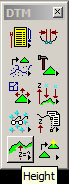 |
By pulling out the set of tools on the bottom left hand corner of the DTM menu, you can access the analysis tools. |
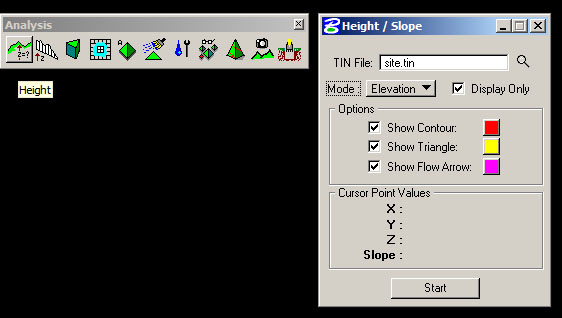 |
The Height tool can allow you to dynamically access data (x,y,x) about the surface such as the contour, the specific triangulated surface, and teh flow direction (of water). |
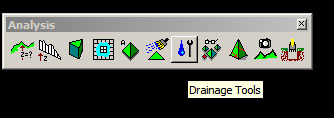 |
The Drainage tools allows you to see the flow of water on the surface. |
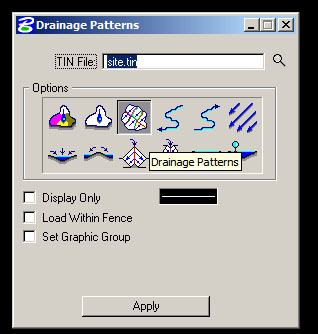 |
Drainage Patterns allows you to access the pattern of drainage as it applies to the entire surface. |
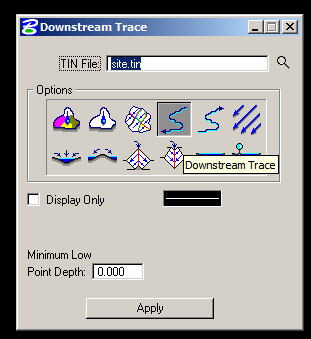 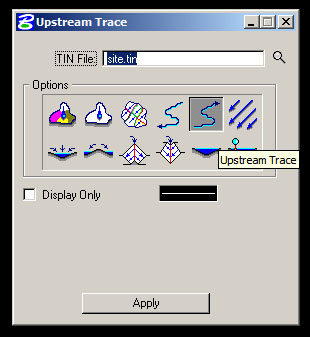 |
The Downstream trace calculates the flow of water from a point (anywhere you click on the model) and will show it on the screen as a path. The Upstream trace allows you to trace a point (anywhere you click on the model) to where the source of water would be. |
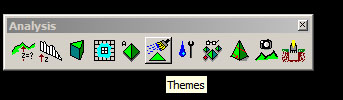 |
The Themes tool is the fifth icon. |
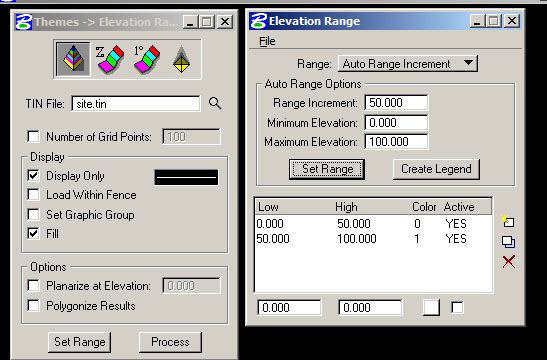 |
The first icon is the elevation range. From here you can start to create a colorized map showing steeper areas versus flatter areas on your surface. 1. Make sure fill is checked. 2. Select Set Range and put in the range options as the to right. 3. Select Set Range below to set the color table. 3. Select Process You can further modify the color table to have a cleaner gradient. |