ARDUINO SENSOR TO PROCESSING GRAPHICS
For this workshop we will collect photosensor data from an Arduino board (Uno or 101 Board) and through the Arduino IDE output the data to a serial port. While the data is being output, we will open up a Processing Sketch to read the data and translate it into a an animated computer graphics outcome. This pathway demonstrates how an Arduino collecing sensor data can be directly used to drive a computer animation via Processing. Below, PART 1 involves working with a photosensor, and PART 2 involves working with a sound sensor.
PART I. Working with the Photosensor
The steps in the sequence are:
1. Setup an Arduino board with a photosensor.
2. Using the Arduino IDE, send the photosensor data to the serial port of a computer attached by a USB A B cable.
3. Within a Processing sketch, receive the serial port data.
4. Use the data to drive a computer graphics animation.
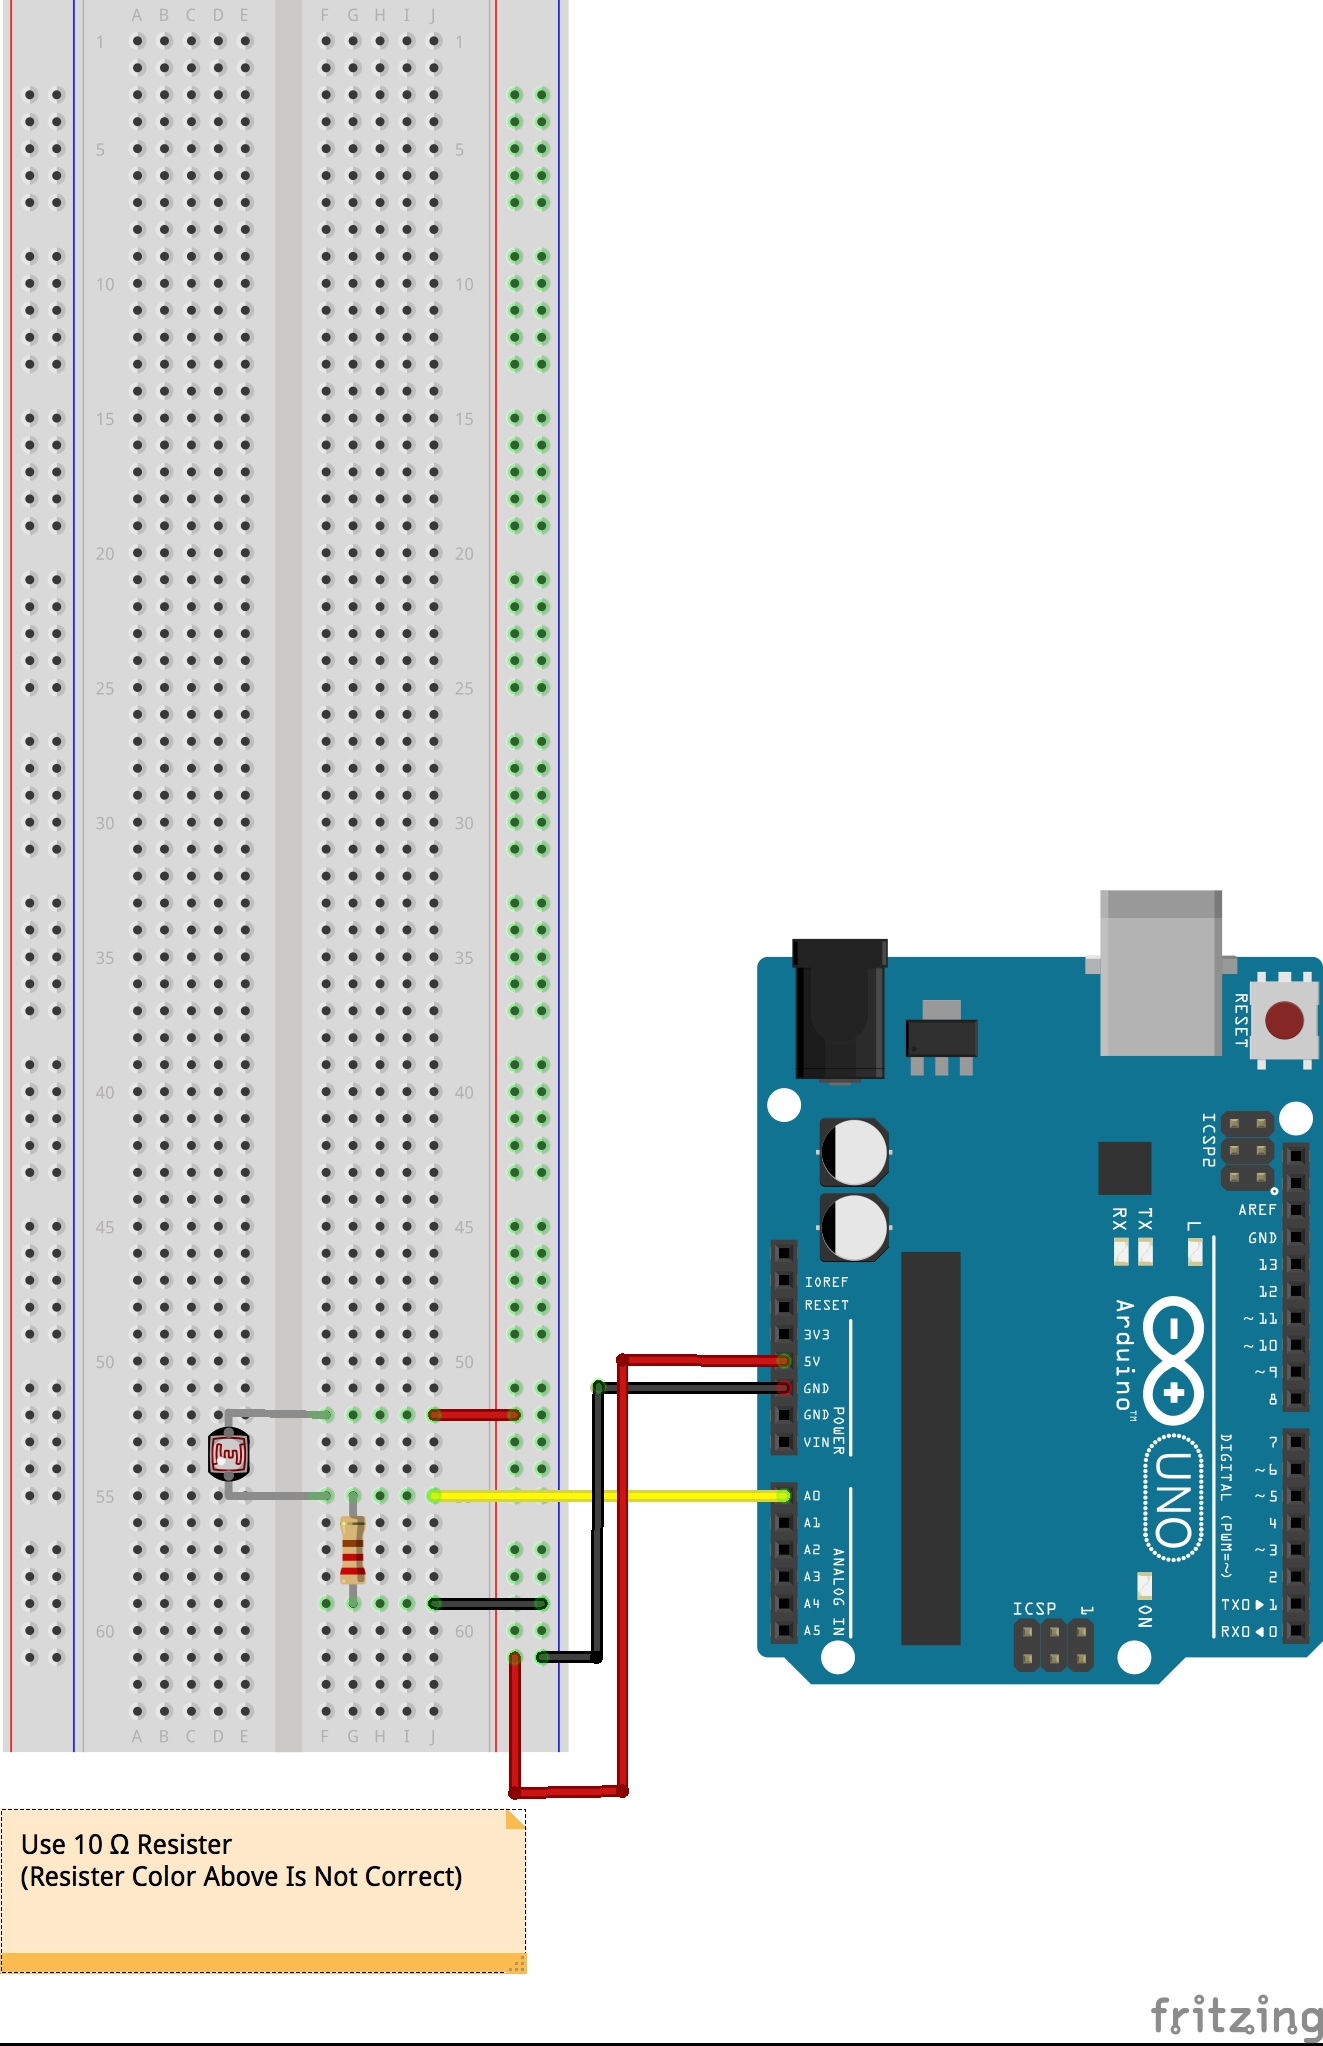
1. To begin, setup a photo sensor with a 10 ohm resister according to the following circuit diagram for a large breadboard:

2. Create or download and run the Arduino program PhtResisterForSerialOutputVals.ino (link to file) below to read the data and send it to a serial port.
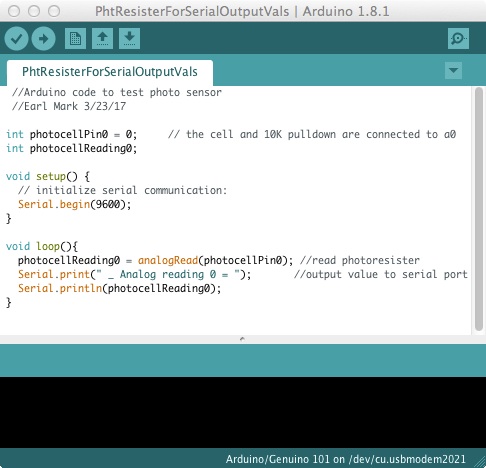
Note the lines within the loop that print the data to the serial port:
Serial.print("_ Analog reading 0 = ");
Serial.println("photocellReading0);
The first line prints out the literal text string "_ Analog reading 0 =", but without entering a line return.
The second line prints out the value of the variable "photocellReading0" (e.g, the number 814) and does enter a line return.
Taken together, the two lines will print out the single line to the along with a line return to the serial port:
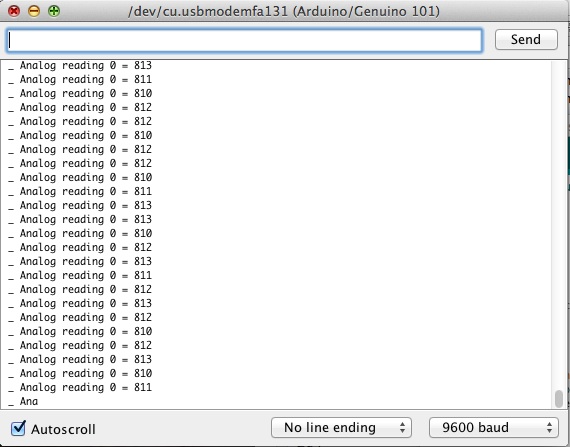
"_ Analog reading 0 = 812"
3. Test the program and check to see that the photo sensor data is being sent to the serial port.
Upon running the program, select the Serial monitor icon in the upper right hand corner:

View the serial port to see the continuous stream of data:
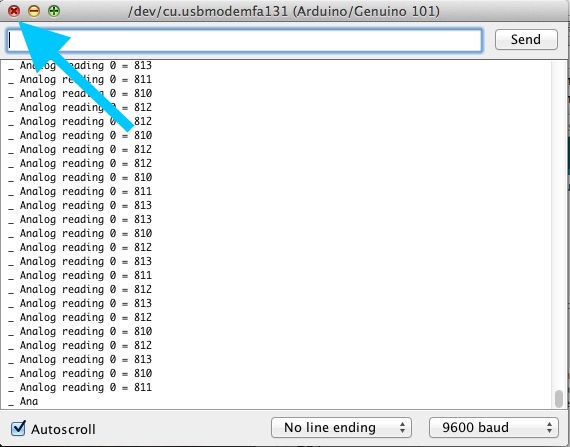
Whie the program is running, simply close the serial port window by selecting the "close" window red icon in the upper left hand corner.
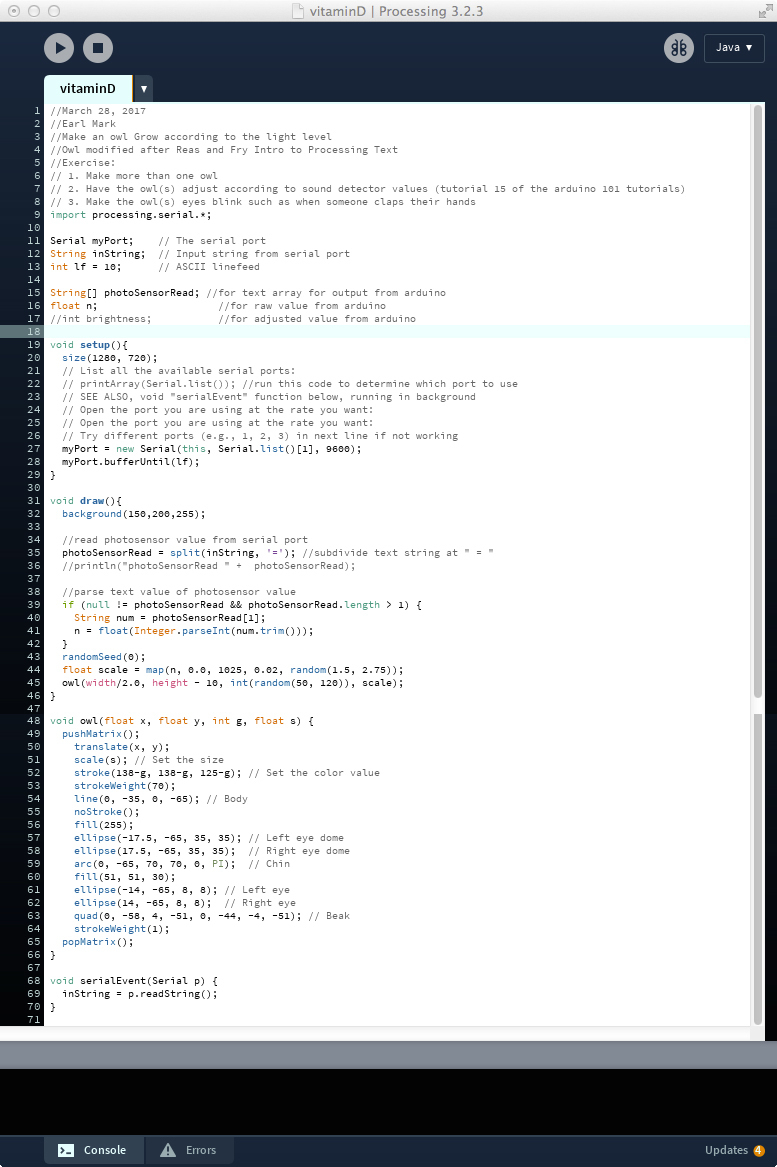
4. Create or download and run the Processing Sketch vitaminD.pde (link to file) below . The program responds to the light data by growing the size of a owl. The owl itself modifed after the Reas and Fry tutorial example illustrated in their introductory book Getting Started With Processing, Media Maker Inc, 2015 (see class syllabus for link for UVA faculty and students). Note that:
line 41 in the program below reads out the streaming values of the light sensor being sent to the serial monitor.
line 44 maps the light sensor value to a range of values from 1.5 to 2.75 for the relative scale of the owl.
line 45 calls the owl function to create an owl at a given scale (i.e., the variable "scale").
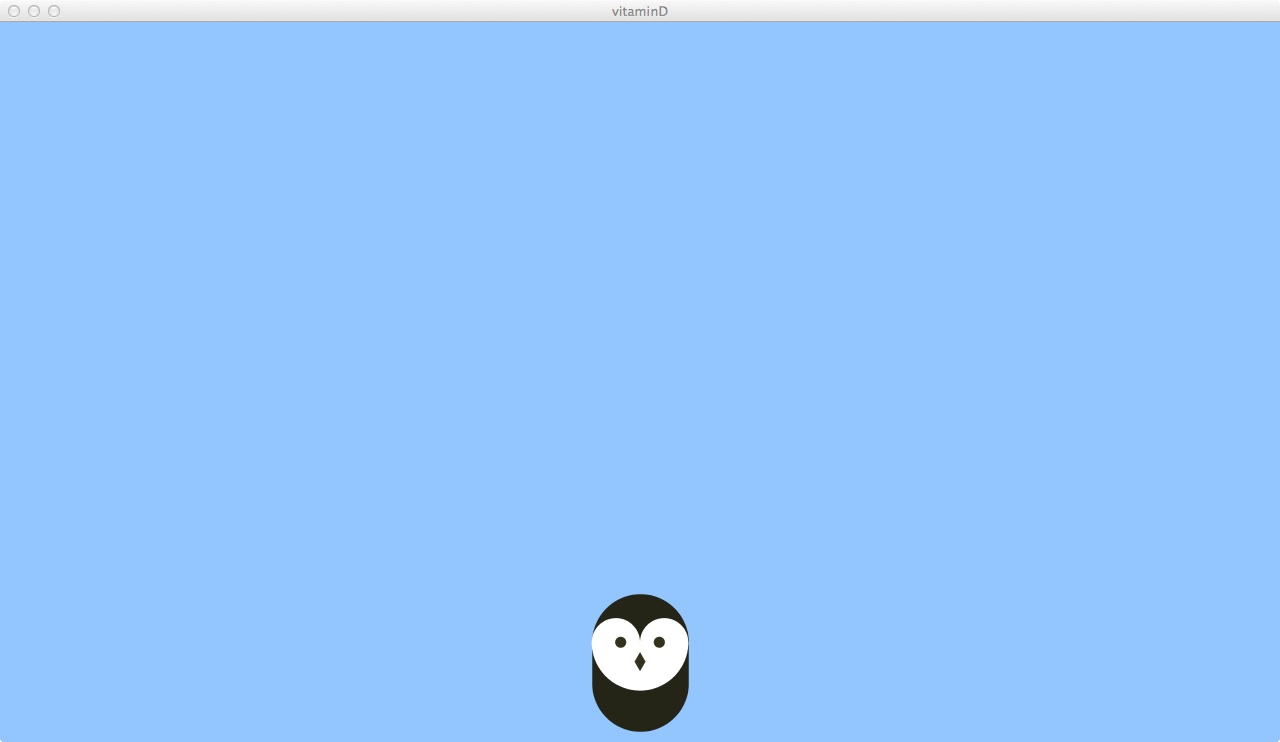
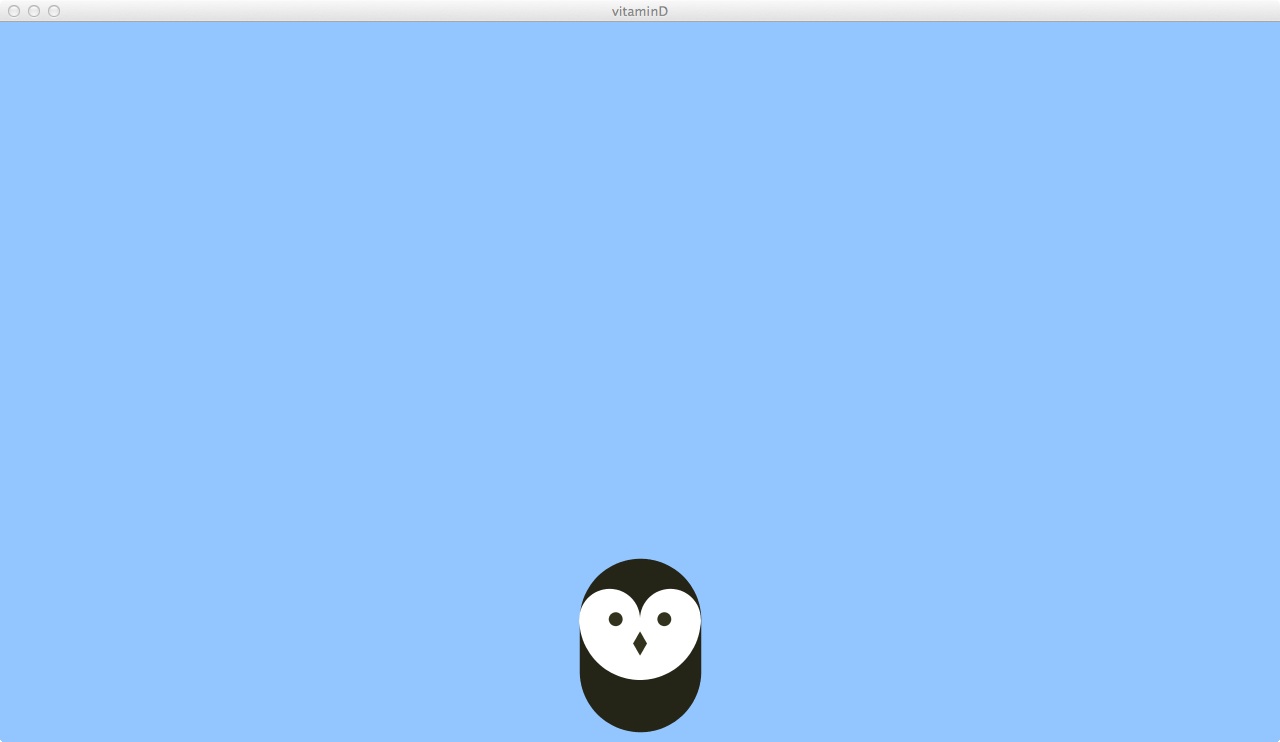
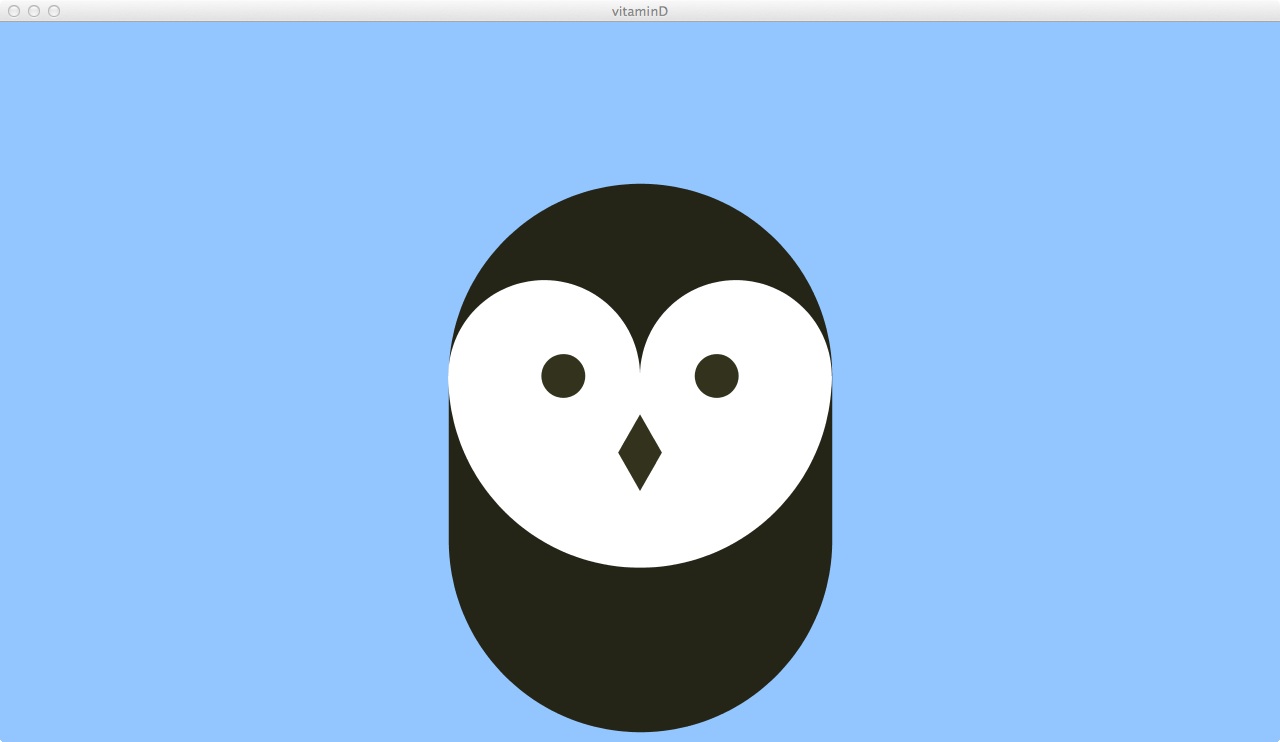
The sketch produces an owl figure at increasing scales in propotion tolight level increases such as would occur by turning up the intensity of a lamp:
 |
 |
 |
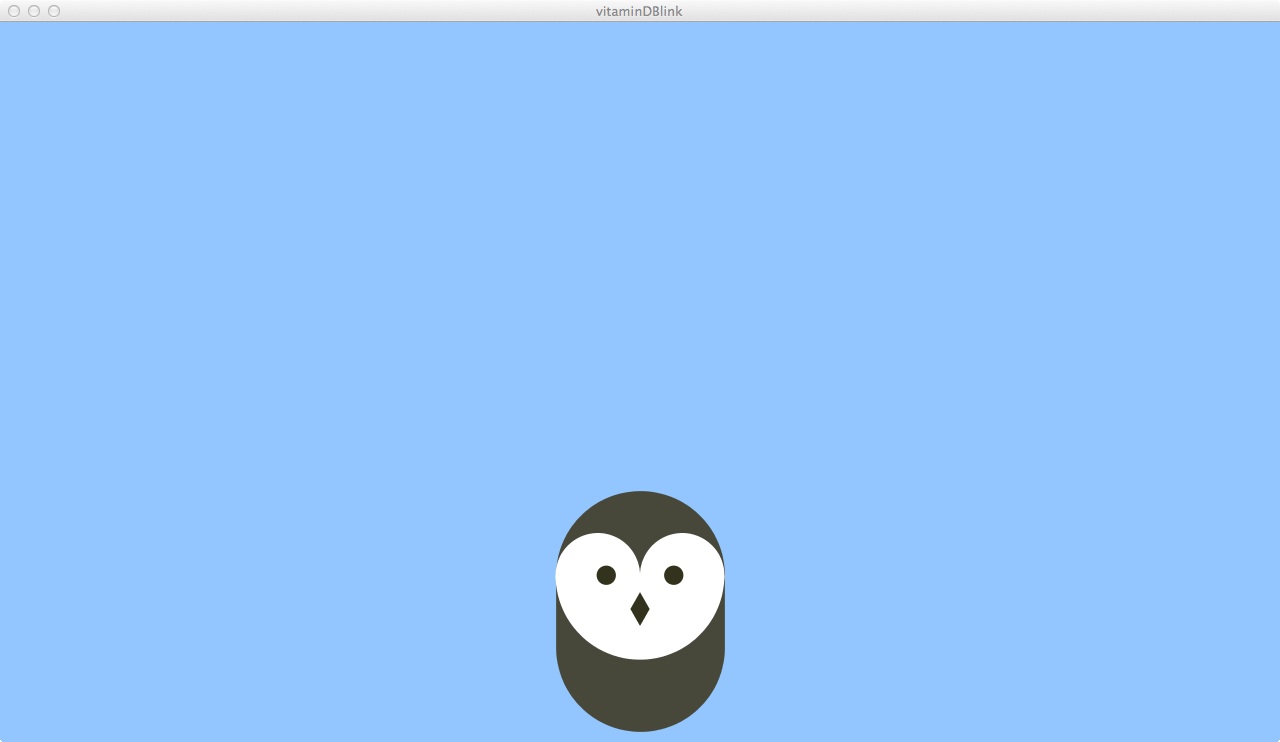
5. For the in-class workshop, the next step to modify the Processing sketch to make an owl blink at random.
 |
 |
 |
6. Still continuing with the owl Processing sketch, the next step is to modify the sketch so to produce a group of owls that blink in some kind of random sequence.

PART II. Working with the Sound Sensor
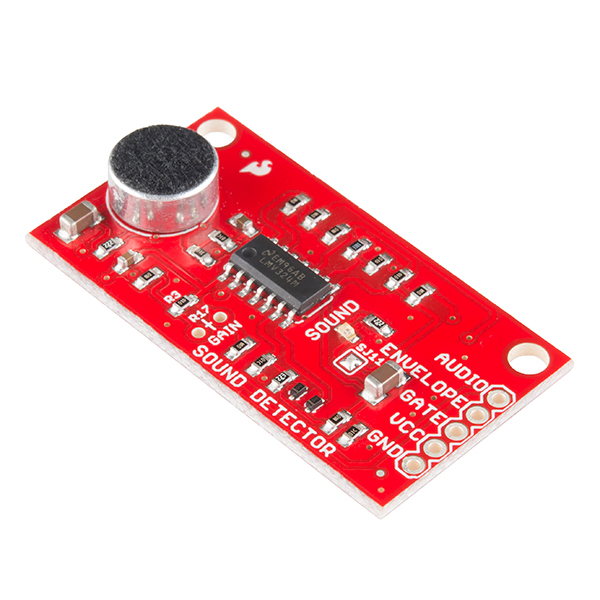
Here the same technique is used to collect sound from an Arudino board sound detector and use its volume to drive a graphics program in Processing. This can be done with a modification to the owl Processing sketch. To create an Aruduino circuit for sound, see Experiment 15 of the Sparkfun tutorial Sparkfun Tutorial for Arduino 101. This tutorial uses the Sparkfun sound detector board (image from Sparkfun.com)
Note that only the Sparkfun board (highlighted inside the blue rectangle) needs to be placed on the breadboard for this example, and not all the components of exercise 15. (image below modified from Sparkfun web site).
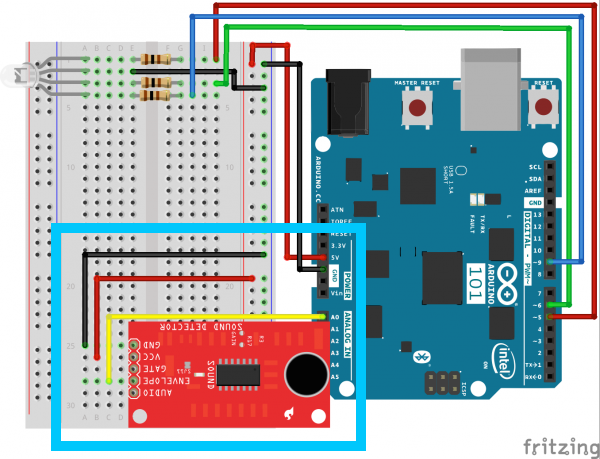
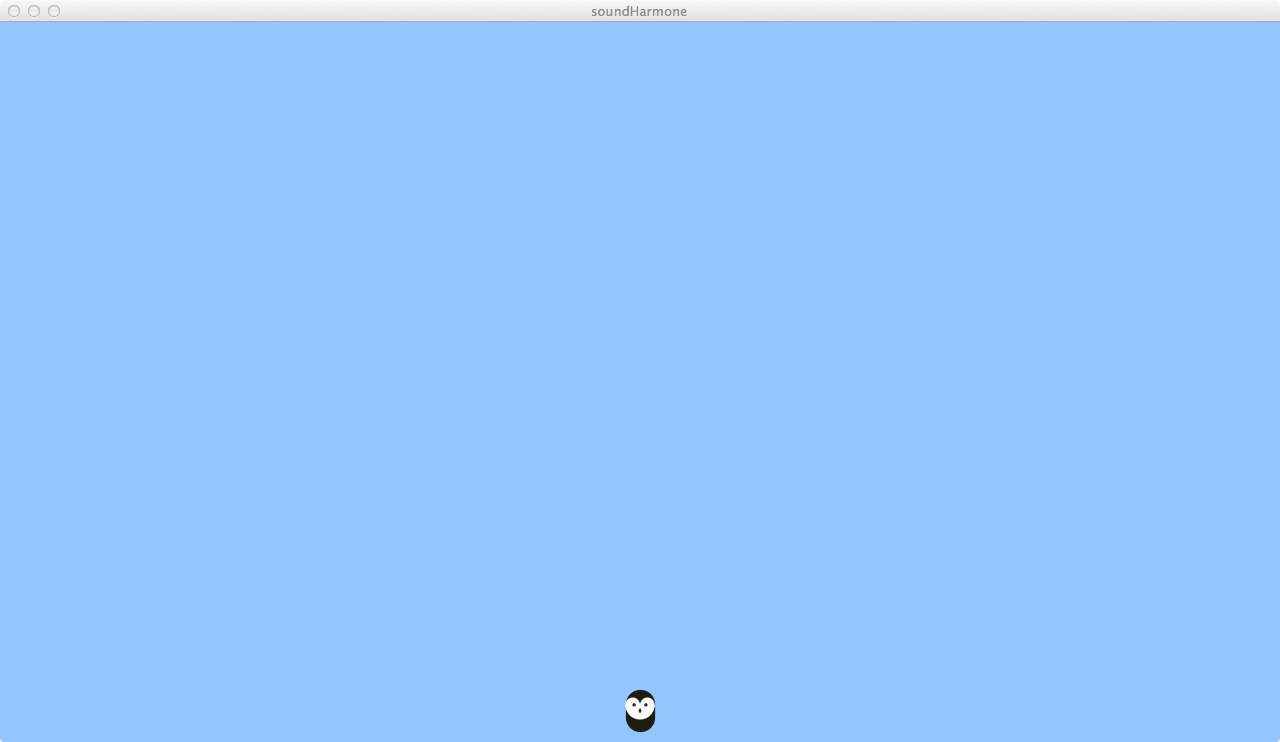
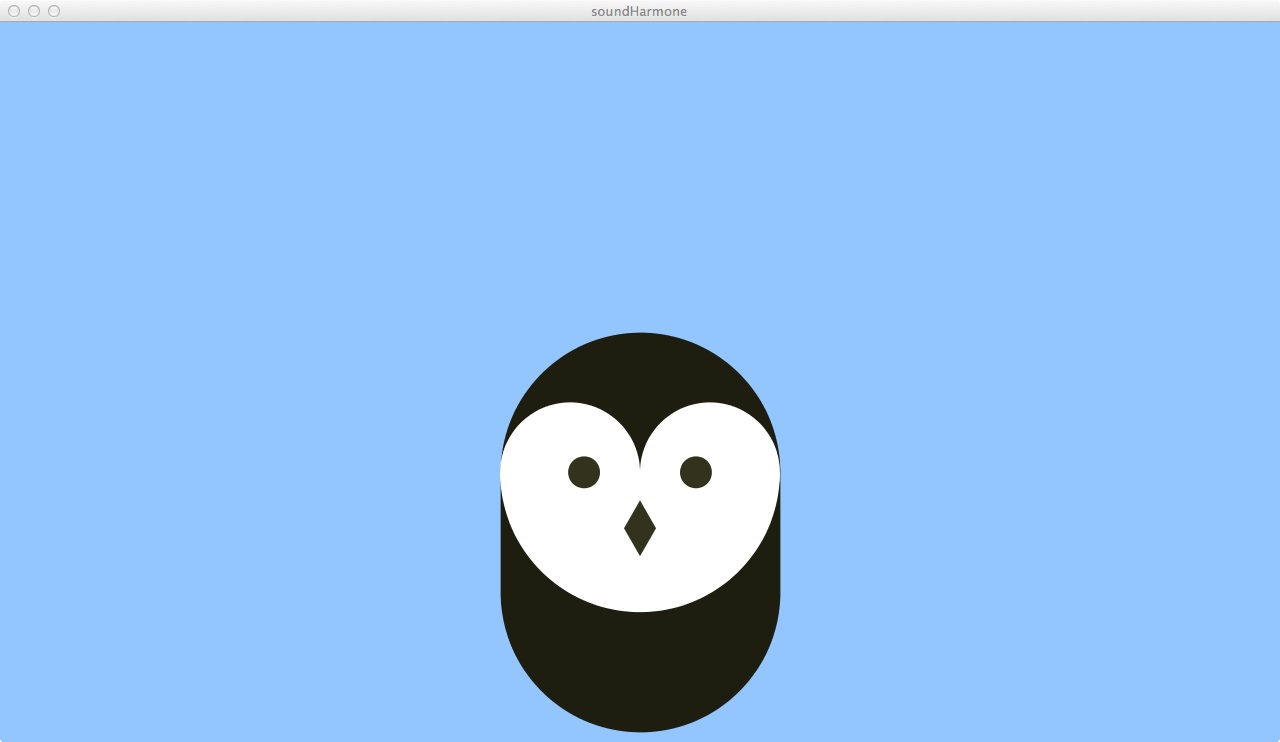
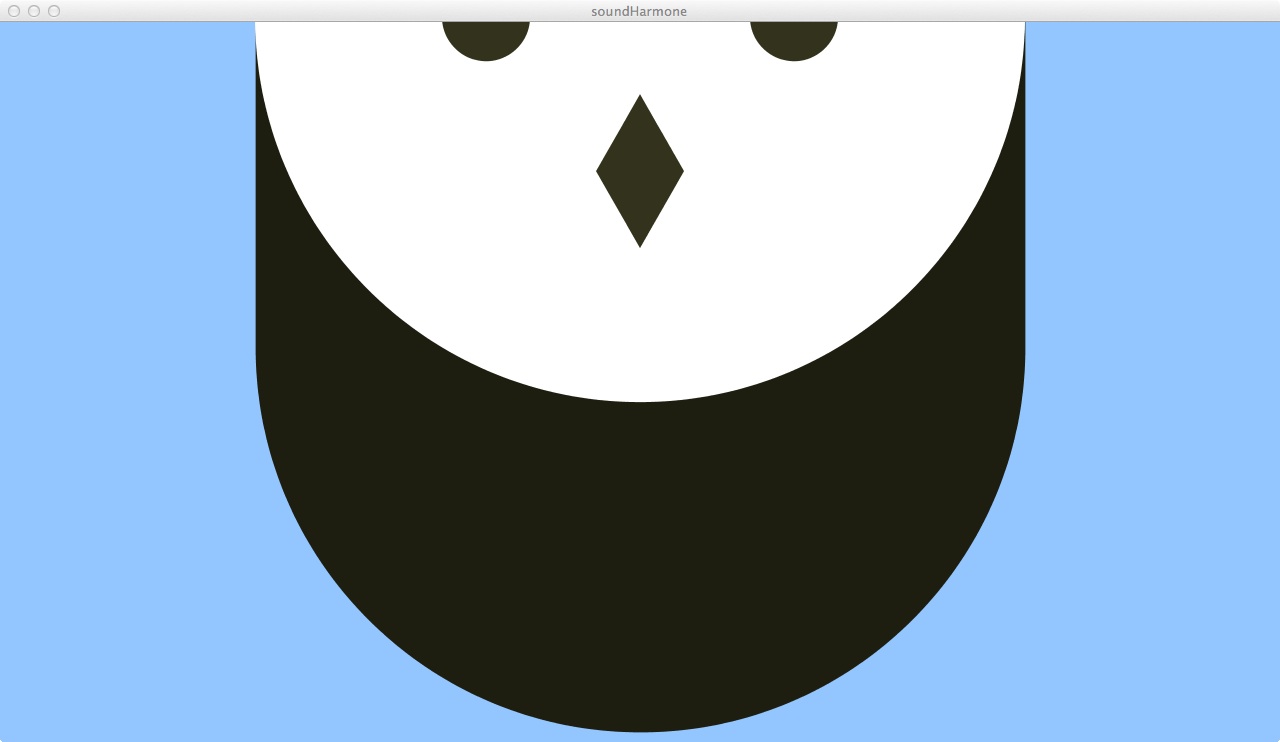
The tutorial can also be adapted to work with pin A1 rather than A0 so that the photosensor component is still availble at pin A0. In parallel to part I, we get a small scale owl in response to a low volume sound, a medium scale owl in response to a medium volume sound, and a large scale owl in response to a high volume sound.
 |
 |
 |
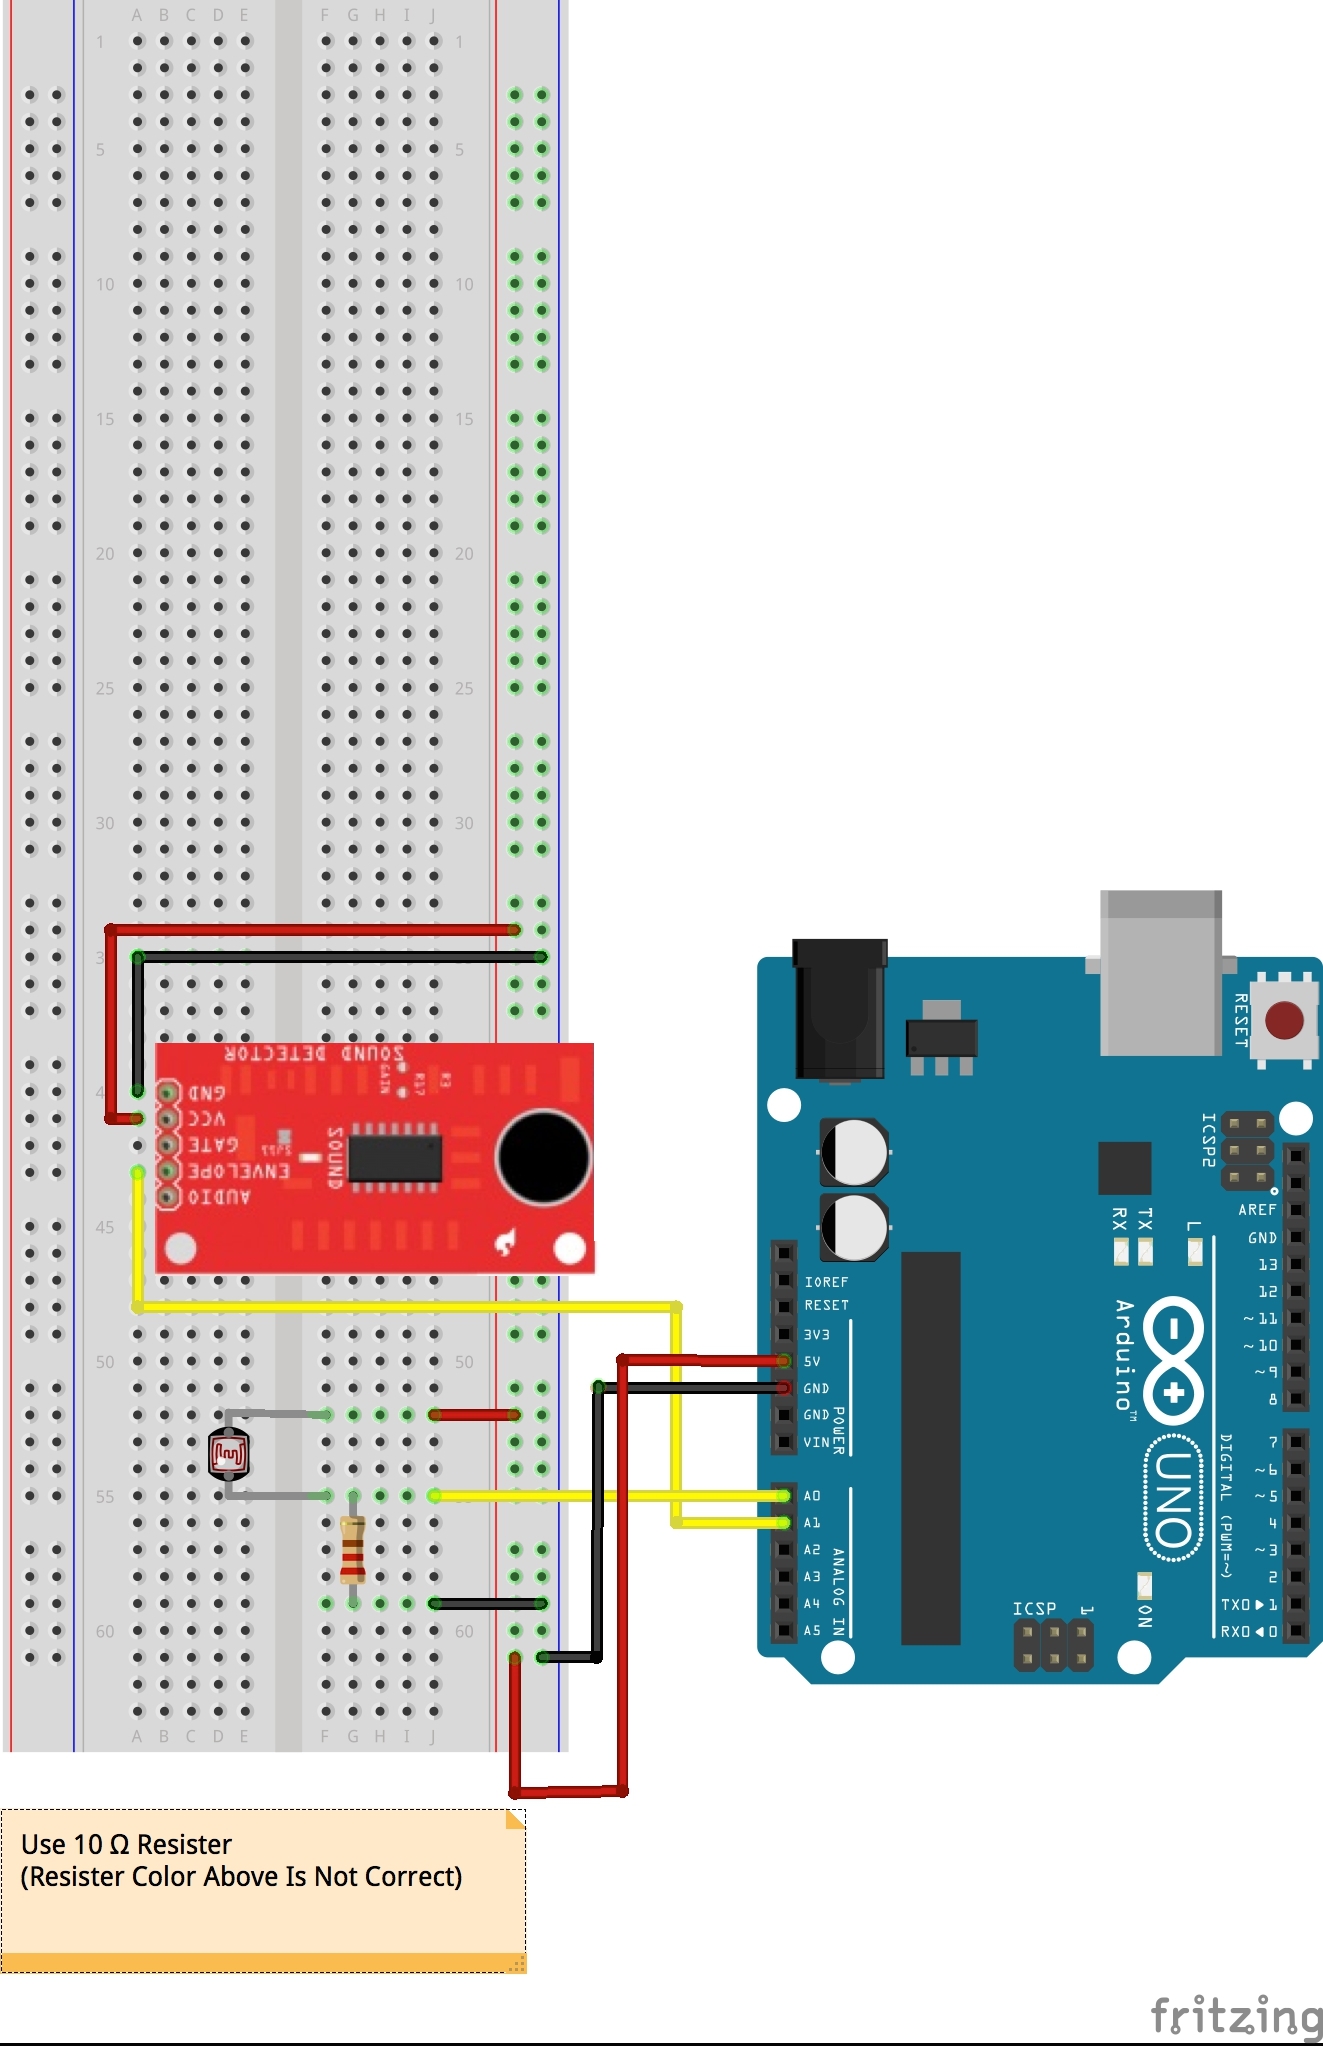
1. To begin modify the Arduino board used in part I according to the following circuit diagram:
2. Create or download and run the Arduino program modifiedSparkfunExperiment15.ino (link to file) below to read the sound volume data and send it to a serial port.
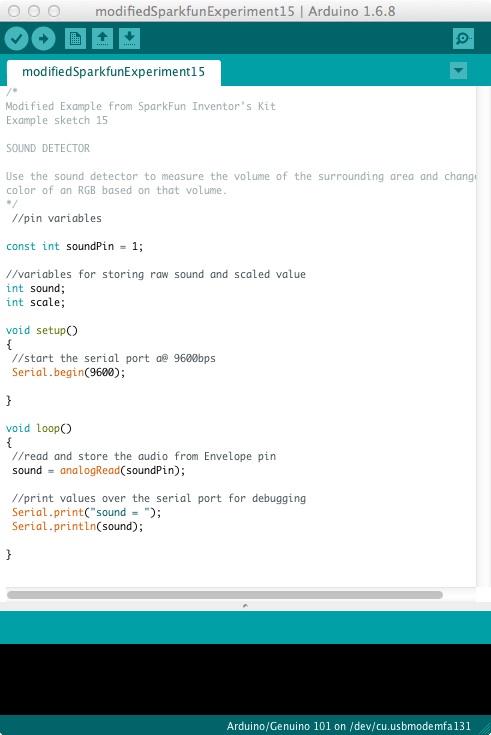
3. Test the serial port as in Part I to ensure that the sound volume data is being output to the serial port.
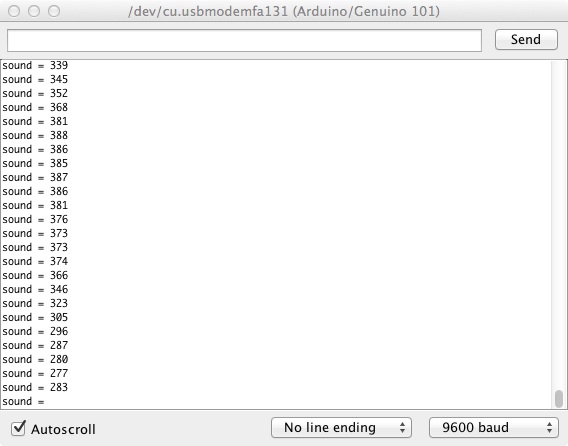
4. Finally, modify the processing Sketch of Part 1 and save it as soundHarmone.pde (link to file) to respond to sound values rather than the light intensity values.
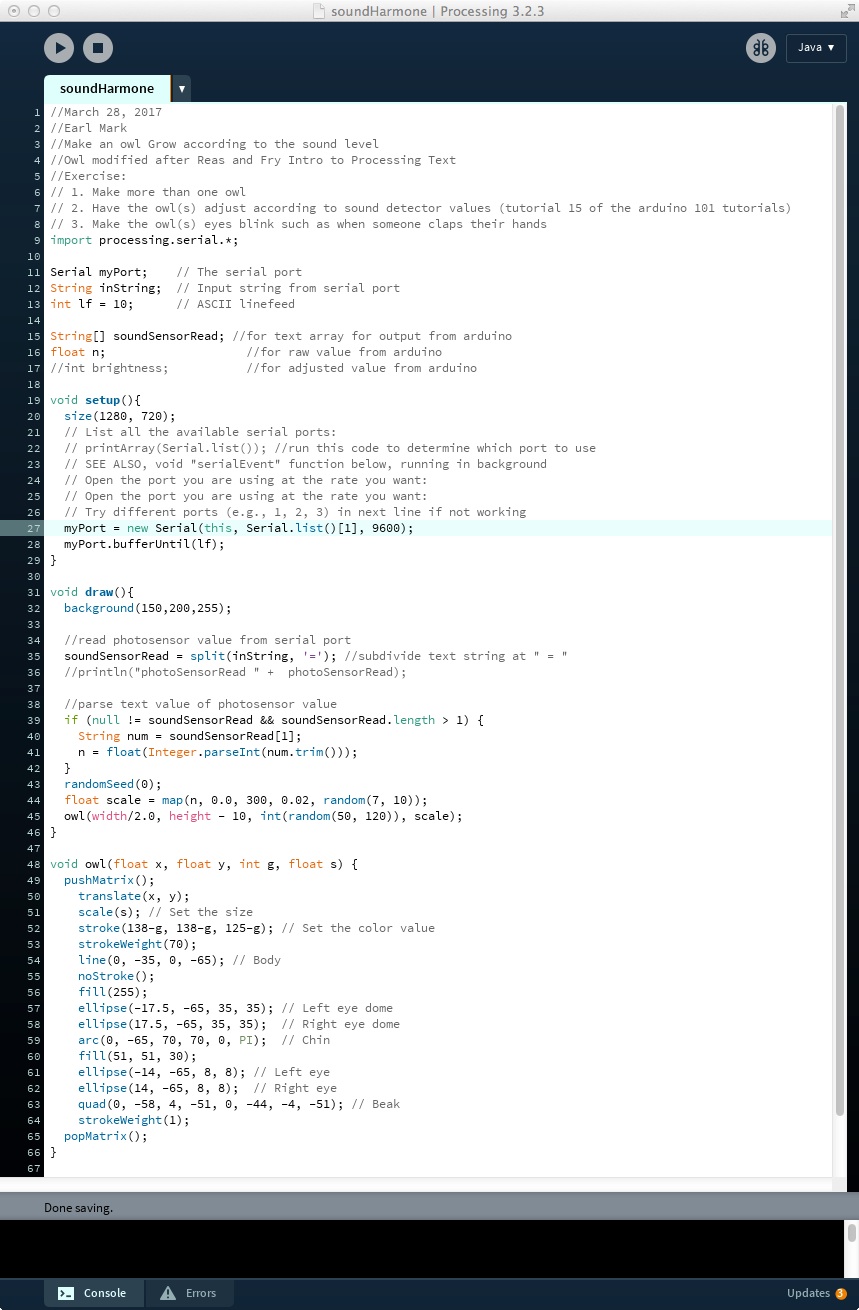
SImilar to part I, it is possible to modify the program to make the owl blink, such as in response to a high volume sound, and to make a group of owls blink in some random order.
We will later examine how to drive a graphical animation in Processing form more than one source of data at a time (e.g., light and sound) transmitted from the Arduino to Processing through the serial port.