Flattening the Curve: Everyone's Doing It
Well, not everyone.
In the wake of the COVID-19 pandemic, we've recently been introduced to, and seemingly overwhelmed by, the concepts of "social distancing" and "flattening the curve." You can't log in to social media without seeing posts about these ideas or turn on the news without seeing news about social distancing and now, protests to try to end the social distancing orders that a lot of states have put in place. These concepts are a bit confusing, and the purpose of this page is to try and demonstrate how these concepts should work at a very basic level.
Social Distancing: What's the Point?
The CDC defines social distancing as keeping space between yourself and other people outside your home. COVID-19 is mainly spread between people who are in close contact with someone who is infected for a long period of time. As a result, staying away from others seems like an obvious solution to avoid becoming ill. Let's take a look at a pretty simple example to demonstrate how social distancing can help slow the spread of COVID-19 and prevent others from getting sick.
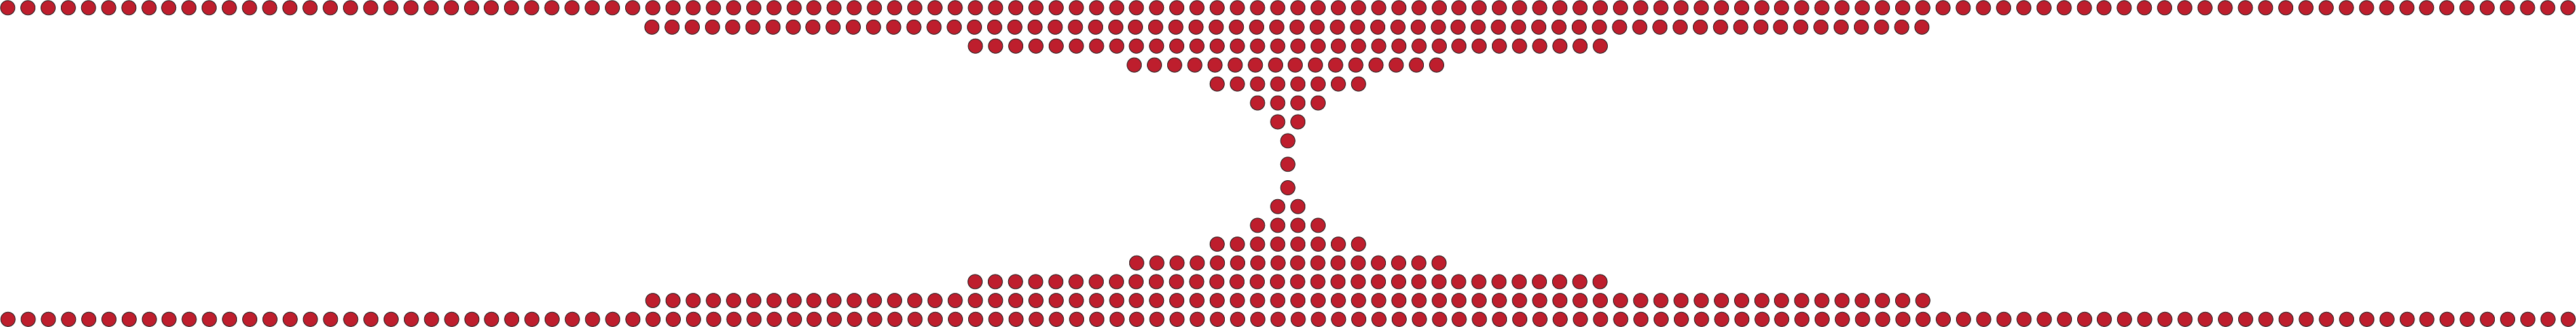
This chart attempts to demonstrate how social distancing is meant to help slow the spread of disease. It is currently believed that COVID-19 has an R0 value of about 2, which basically means that on average, one person who is sick will infect two more people. The center point represents the first case of COVID-19. The original person will infect two people, seen in the points above and below the center point. Each of those people will go on to infect 2 people, leaving us with 4 new cases. As we move out from the original case, we see how quickly the disease can spread, going from 1 single case to 256 new cases in just a handful of transmissions from the original case.
Mouse over the chart to see what will happen if just one person stays and is unable to infect any other people. The yellow point represents the person who has social distanced, and the gray points are those who will no longer become ill as a result. It's pretty easy to see how social distancing can help prevent people from becoming sick and slow the spread of disease as a result
What is "Flattening the Curve"?
The point of social distancing is to flatten the curve by reducing the R0 value so that it falls below 1, where infected people are able to infect less than 1 other person on average. We've all heard about how important it is to flatten the curve, but what does it mean, really?
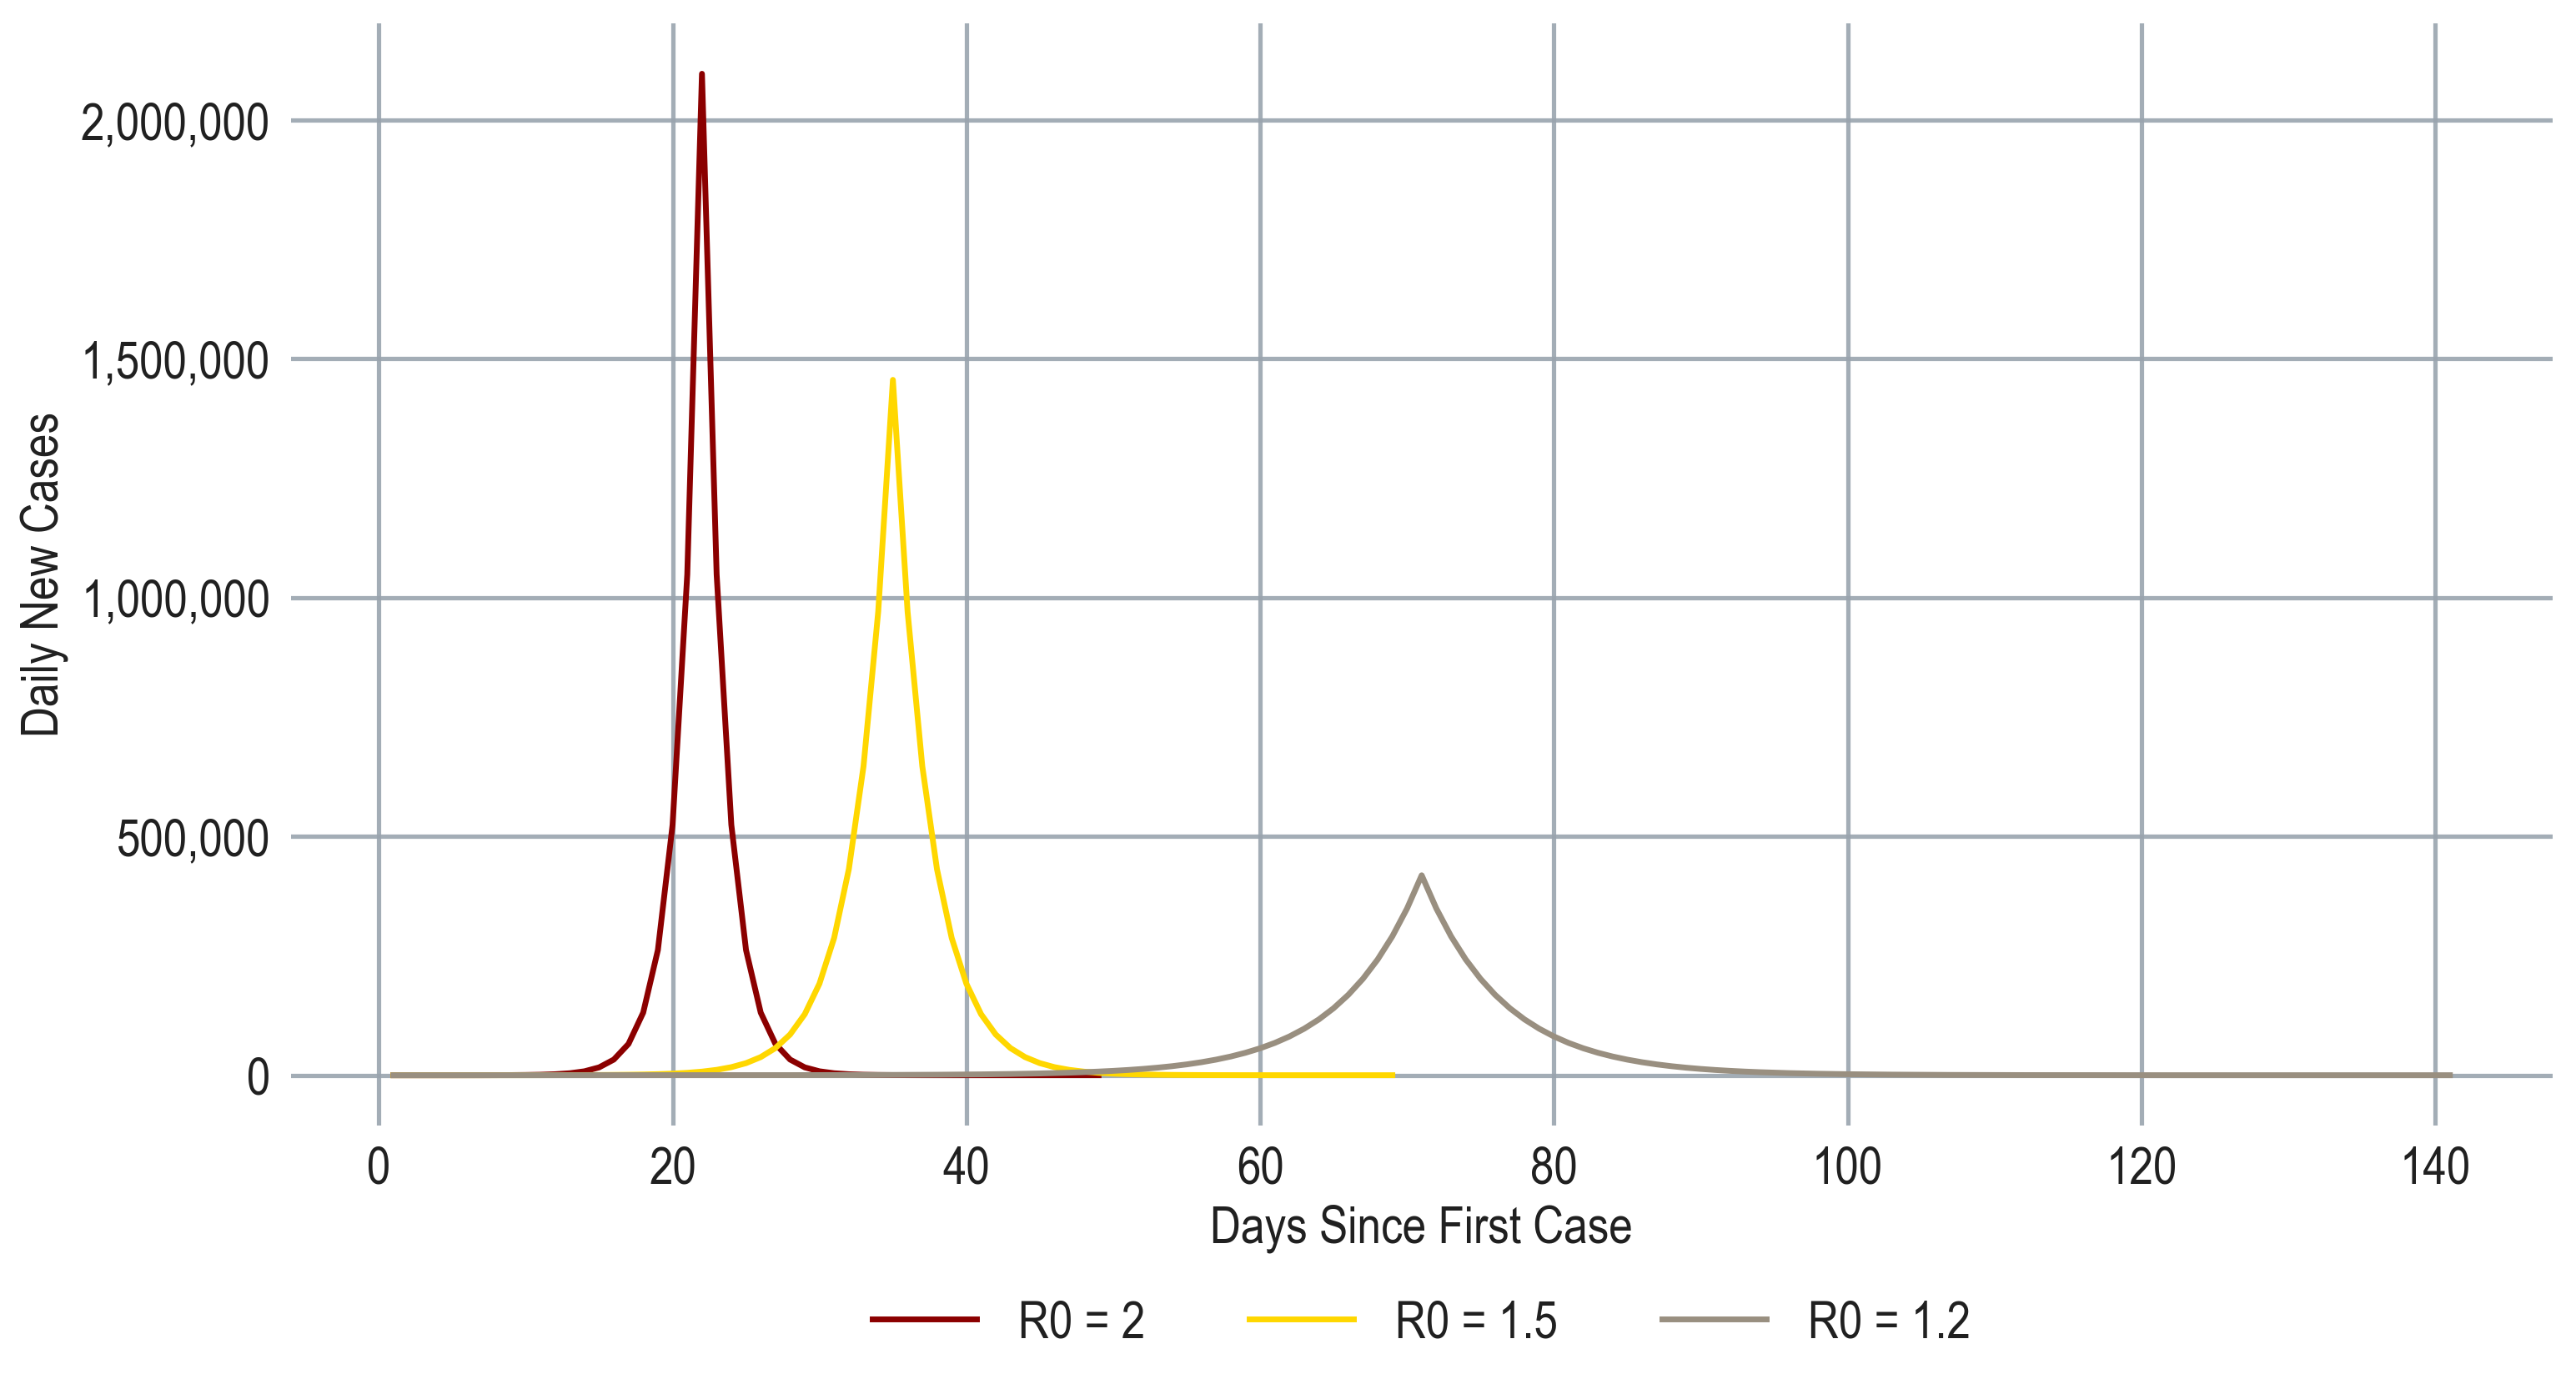
Here, we demonstrate how the curve is flattened at lower R0 values. In this case, flattening the curve means that we are looking for a lower peak number of cases at a later date, which is evident in the different between R0 = 2 and R0=1.2. It is important to note that the disease itself does not become any less infectious with social distancing, but the spread is slowed when we are not in close contact with others outside our home.