data visualization |
|||
| Making Decisions Visual Informatics in the UVA Bay Game |
|||
|
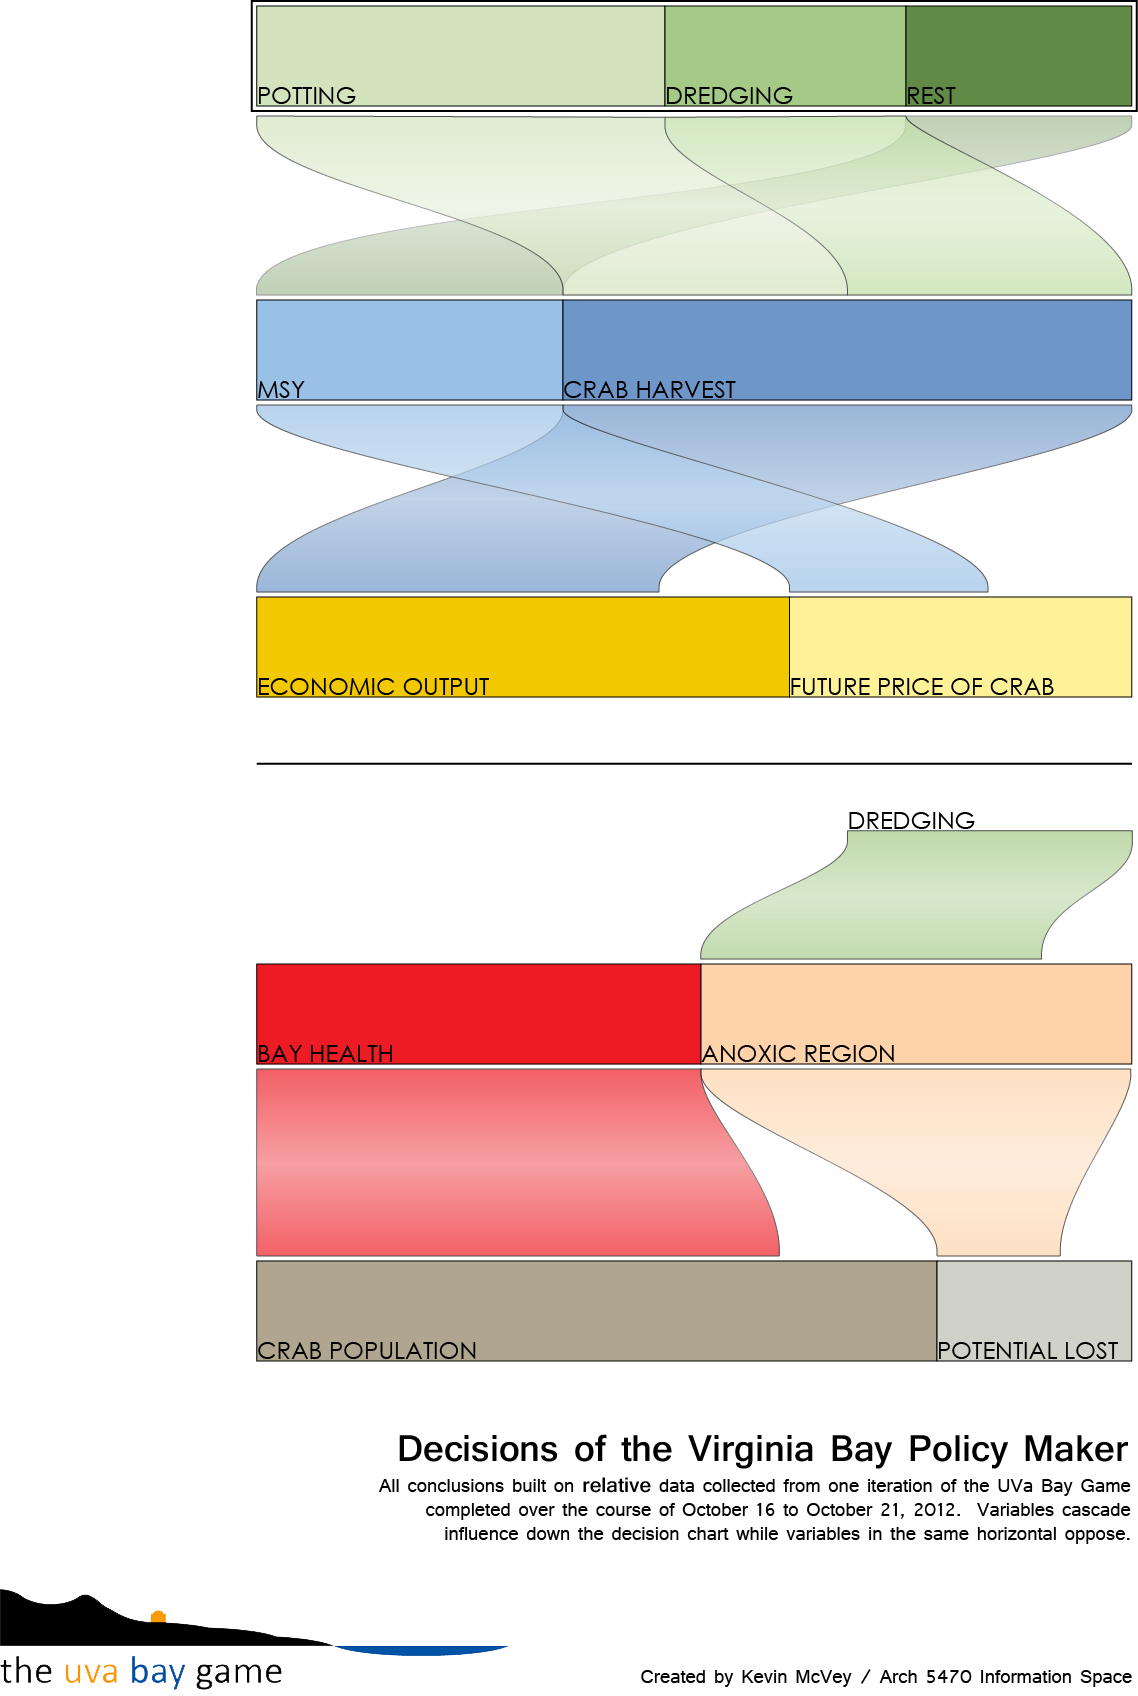 The UVa Bay Game is a "decision support system", tucked within a multiplayer participatory simulation "game". It has a lot of information in it, and a suite of complex interactions. In some ways, information is simply presented - as data - without any direct cause/effect or explicit relational context. As is so often the case in real life, a wealth of information is made available, and it is up to you to synthesize it, interpret it, assign it meaning and context, and make decisions based upon it. The game's visualizations help with this through making information available, presenting it analytically, providing it context and comparison, and in setting up a forum where the human agents (i.e. you) can act. But the game doesn't analyze it or make decisions for you. In this assignment, you will propose ways to analyze and put this information into decision contexts. You will turn "data" into "information".
Good visualizations are driven by good questions. Do not limit this to just your own decisions and data. Put it all in context. Ask a pertinent question related to your player role, your goals during play, and your own process of making decisions over time, and develop a visual strategy to see into the system. What is the relationship between ...? If this did this, and that did that, then what happens when ...? In the set of consequences of the game, what is the evidence for, or the value of, ...? etc.
Given your role, and including your perceptions and knowledge of the overall group of players, issues, data sets, dynamics, and human, natural and economic interactions of the game, Don't worry that you don't have all of the information (you rarely do). Position a way to contextualize, and make meaningful, the information that you do have.
Get data -> assemble data -> contextualize it relationally -> gain insight -> ask a better question -> We are not expecting that you fully resolve or unequivocally answer the question, but rather that you position (through visualization) a clear and useful strategy for trying to understand, assess, and expose it, and play out that strategy (and perhaps some "what-if" options within that strategy) to see what it reveals.
What to turn in: We will review with in-class group discussion. |
|||